Skip to content

fix: an aggregation over a binary expression aggregates the whole binary, like Loki - #741

Draft
szibis wants to merge 18 commits into
mainfrom
fix/aggregation-over-binary
Draft

szibis wants to merge 18 commits into
mainfrom
fix/aggregation-over-binary

Conversation

@szibis

@szibis szibis commented Oct 12, 2026 •

Copy link
Copy Markdown
Collaborator

Stacked on #735, and to be rebased onto #744. Merge order: #735 → #744 → this PR. #744 owns the vector support in applyLabelReplace; on that rebase this branch drops its own version of that change. The label transform around an aggregated binary (cluster f2066991's wrapped /query) is now routed and applied after the fold on both endpoints. The fold keys series by the escaped label key and orders them by Loki's pairwise label comparison. A new open row covers the binary step grid off the start (semantics/binary-step-grid), and another covers x/0 (semantics/binary-division-by-zero-nan). The folded-output series limit (after #739) and NaN min/max (after #734) are deferred.

Summary

New gap semantics/aggregation-over-binary-dropped, which owns parity cluster f2066991.

A vector aggregation over a binary expression silently returned wrong values. Examples:

  • sum by (job) (rate(A[1m]) / count_over_time(A[1m]))
  • sum(rate({app="x"}[1m]) / 2)
  • sum by (cluster) (A + ignoring(machine) B)

The proxy sent only a top-level binary to the binary evaluator. An aggregation over a binary went to the translator instead, and the translator kept the first operand's stats chain. It dropped the operator and the second operand (/ B, / 2, > 0.5, on/group_left) and answered 200 with that operand's values. On instant queries, a literal or nested binary as the first operand was rejected with 400.

Loki 3.7.7 joins per series and then folds per step. Sources:

  • pkg/logql/evaluator.go:791 newBinOpStepEvaluator
  • :955 vectorBinop
  • :1096 resultMetric
  • :400-630 VectorAggEvaluator
  • pkg/logql/syntax/ast.go:1944 MergeBinOp

Fix.

  • Detection and routing. The new internal/proxy/binary_aggregation.go recognises sum, avg, min, max and count (with by, without or no grouping, and nested) over a binary expression. These queries now route to the existing binary evaluator on query_range and query.
  • Evaluation. Each operand stays a native VictoriaLogs stats query. The proxy joins the aggregated operand series as before, then folds per step with applyWithoutGrouping, innermost aggregation first. No raw rows.
  • Errors and offsets. Error statuses are kept. Mixed offsets are supported.
  • Per-operand parsers. Each operand keeps its own parser stage, so a json operand next to a logfmt operand works (the f2066991 shape).
  • Series order. Folded series are ordered by labels, as Loki sorts its result.

Tests

  • TestAggregationOverBinaryEdgeCases: 25 cases, handler-level against a VictoriaLogs emulator on v1.52 and v1.40.
    • Every operator.
    • by, without and no grouping.
    • A scalar on either side.
    • Comparisons with and without bool.
    • on/ignoring with group_left.
    • Nested binaries and an empty result.
  • Also new: range, mixed offset, uniform offset, per-operand parsers, and a label_replace operand staying on the binary evaluator.
  • TestAggregationOverBinaryDifferential: an independent Loki-semantics reference. It passed 3,200 scenarios locally and 40 iterations are committed. It includes the sum by (job)(A) + ignoring(machine) sum by (job, machine)(B) shape.
  • e2e vs Loki: TestCompat_AggregationOverBinary, TestCompat_AggregationOverBinaryMixedParsers.

This also fixes the outer-sum symptom of semantics/binary-ignoring-matching, whose join fixes are on a separate branch.

Pending before ready

  • e2e against Loki on VictoriaLogs v1.52.0 and v1.47.0.
  • A/B plus the control set, visual capture, benchstat and the load test.
  • Reconcile with fix: an instant query keeps its failure status and always answers a resultType #735: it adds an open stub for this row. Whichever PR merges second keeps this fixed version.
  • Register these new gap drafts:
    • topk/sort/stddev/stdvar over a binary;
    • label_replace as a binary operand loses its destination label;
    • label_join around an aggregated binary;
    • x/0 gives ±Inf where Loki gives NaN.

…esultType

A query handleQuery post-processes (without, label_replace, label_join) was
buffered and a failure of it was written with the status dropped, so an error
reached the client as a 200 with no data and no resultType; query_range already
sent the failing status, the instant path now does too. A label_replace or
label_join around a binary expression sent the translator's internal binary
marker to VictoriaLogs as a query; the expression under the transform now
routes like any binary expression.

Also on the instant endpoint: a scalar literal answers a scalar as Loki's
evalLiteral does, vector() stamps its sample in seconds, and a log query with
every tenant filtered out is rejected with Loki's 400 instead of an empty
streams answer.
…the proxy alone

The instant result-type table runs as a bare client, Grafana Explore and Logs
Drilldown, which take their own failure and series-limit branches. The
multi-tenant e2e checks the proxy against the type Loki gives the expression,
as the compose Loki is not configured for multi-tenant queries.
… instant constants follow Loki

label_replace and label_join split the expression they wrap at the first comma
outside strings and brackets, in the translator and in the instant routing, so a
parenthesis or comma in a line filter or a matcher no longer sends the query to
the log path or the binary marker to VictoriaLogs. vector(n) with a scalar, and
a scalar with vector(n), are evaluated as constants through one path, a literal
division by zero is NaN as in Loki's MergeBinOp, and with every tenant filtered
out an unparseable query gets the parse error. Cluster f2066991 is no longer
claimed by the instant result-type row; a stub row owns it.
szibis added a commit that referenced this pull request Oct 12, 2026
@github-actions github-actions Bot added size/XL Extra large change scope/proxy Proxy core scope/docs Documentation scope/tests Tests bugfix Bug fix and removed size/XL Extra large change labels Oct 12, 2026
@github-actions

github-actions Bot commented Oct 12, 2026 •

Copy link
Copy Markdown
Contributor

⚪ Performance A/B: no change beyond noise

101 shape×range — 101 ⚪ same · results vs Loki: 84 same, 0 new difference(s), 17 pre-existing

Every shape is within noise of the base build (±30% and 100 ms).

101 unchanged shape×range (within noise)
shape range base p50 PR p50 change Loki p50 PR ÷ Loki result vs Loki
⚪ bytes_over_time by app 1h 73 ms 69 ms ⚪ -5% 88 ms 0.78× ✅ same
⚪ drilldown service landing 1h 33 ms 33 ms ⚪ +0% 28 ms 1.18× ✅ same
⚪ instant json filtered instant 390 ms 398 ms ⚪ +2% 72 ms 5.53× ✅ same
⚪ instant json volume instant 438 ms 445 ms ⚪ +2% 94 ms 4.73× ✅ same
⚪ instant ungrouped rate instant 8 ms 7 ms ⚪ -12% 72 ms 0.10× ✅ same
⚪ json rate by level (no filter, no drop) 1h 400 400 ⚪ +0% 400 — ✅ same
⚪ json volume no filters 1h 191 ms 192 ms ⚪ +1% 3 ms 64× ✅ same
⚪ logfmt count by level, filter, drop 1h 447 ms 442 ms ⚪ -1% 58 ms 7.62× ✅ same
⚪ logfmt volume 1h 296 ms 292 ms ⚪ -1% 61 ms 4.79× ✅ same
⚪ logs plain 1h 69 ms 66 ms ⚪ -4% 37 ms 1.78× ✅ same
⚪ logs | json 1h 94 ms 102 ms ⚪ +9% 60 ms 1.70× ✅ same
⚪ logs | logfmt 1h 161 ms 155 ms ⚪ -4% 49 ms 3.16× ✅ same
⚪ stream-label count by app 1h 27 ms 25 ms ⚪ -7% 39 ms 0.64× ✅ same
⚪ topk rate by app 1h 46 ms 45 ms ⚪ -2% 87 ms 0.52× ➖ differs (as base)
⚪ ungrouped rate 1h 11 ms 13 ms ⚪ +18% 80 ms 0.16× ✅ same
⚪ DB1 label breakdown pod 1h 77 ms 83 ms ⚪ +8% 112 ms 0.74× ✅ same
⚪ DB2 label breakdown namespace 1h 17 ms 17 ms ⚪ +0% 31 ms 0.55× ✅ same
⚪ DB3 json field breakdown user_id 1h 47 ms 48 ms ⚪ +2% 24 ms 2.00× ✅ same
⚪ DB4 json field breakdown batch_id 1h 96 ms 93 ms ⚪ -3% 52 ms 1.79× ✅ same
⚪ X1 json filter level_extracted, by level 1h 392 ms 388 ms ⚪ -1% 42 ms 9.24× ✅ same
⚪ X2 json group by level_extracted 1h 320 ms 320 ms ⚪ +0% 45 ms 7.11× ✅ same
⚪ X3 json rate, level_extracted equality 1h 293 ms 294 ms ⚪ +0% 34 ms 8.65× ✅ same
⚪ X4 json bytes, level_extracted regexp 1h 395 ms 391 ms ⚪ -1% 90 ms 4.34× ✅ same
⚪ X5 logfmt filter level_extracted, by level 1h 696 ms 675 ms ⚪ -3% 53 ms 13× ✅ same
⚪ E1 logs, json parser over stream labels 1h 113 ms 120 ms ⚪ +6% 62 ms 1.94× ✅ same
⚪ E2 logs, logfmt parser over stream labels 1h 71 ms 77 ms ⚪ +8% 52 ms 1.48× ✅ same
⚪ E3 logs, json, existence filter on level_extracted 1h 142 ms 141 ms ⚪ -1% 71 ms 1.99× ✅ same
⚪ E4 logs, logfmt, existence filter on level_extracted 1h 90 ms 90 ms ⚪ +0% 60 ms 1.50× ✅ same
⚪ E5 logs, json, drop level_extracted 1h 120 ms 110 ms ⚪ -8% 60 ms 1.83× ✅ same
⚪ E6 logfmt count by level_extracted 1h 48 ms 45 ms ⚪ -6% 7 ms 6.43× ✅ same
⚪ E7 json count by level_extracted 1h 149 ms 151 ms ⚪ +1% 14 ms 11× ✅ same
⚪ E8 instant logfmt by level_extracted instant 6 ms 7 ms ⚪ +17% 9 ms 0.78× ✅ same
⚪ A explore volume, 2 filters, drop 1h 136 ms 146 ms ⚪ +7% 108 ms 1.35× ✅ same
⚪ B grouped sum, filter, no drop 1h 103 ms 101 ms ⚪ -2% 103 ms 0.98× ✅ same
⚪ C ungrouped sum, filter, no drop 1h 101 ms 102 ms ⚪ +1% 34 ms 3.00× ✅ same
⚪ D volume, no filters 1h 217 ms 227 ms ⚪ +5% 46 ms 4.93× ✅ same
⚪ E field breakdown pipeline (explore) 1h 101 ms 102 ms ⚪ +1% 35 ms 2.91× ✅ same
⚪ F field breakdown service_version (explore) 1h 154 ms 141 ms ⚪ -8% 43 ms 3.28× ✅ same
⚪ G field breakdown pipeline (drilldown) 1h 44 ms 47 ms ⚪ +7% 23 ms 2.04× ✅ same
⚪ H field breakdown service_version (drilldown) 1h 82 ms 79 ms ⚪ -4% 25 ms 3.16× ✅ same
⚪ I grafana volume of B 1h 98 ms 100 ms ⚪ +2% 34 ms 2.94× ✅ same
⚪ O2 explore log volume (Grafana form), underscore structured-metadata filter 1h 70 ms 72 ms ⚪ +3% 36 ms 2.00× ✅ same
⚪ DL1 drilldown field breakdown json-expr, level filter 1h 489 ms 500 ms ⚪ +2% 23 ms 22× ✅ same
⚪ DL2 drilldown field breakdown, level + stream-label filter before json 1h 48 ms 52 ms ⚪ +8% 6 ms 8.67× ✅ same
⚪ DL3 drilldown logfmt field breakdown, level filter 1h 605 ms 604 ms ⚪ -0% 92 ms 6.57× ➖ differs (as base)
⚪ DL4 instant count, level filter, json+logfmt, 1h instant 523 ms 507 ms ⚪ -3% 1.32 s 0.38× ✅ sum ±0.22%
⚪ DL6 explore volume, level filter before json 1h 505 ms 501 ms ⚪ -1% 40 ms 13× ✅ sum ±0.22%
⚪ OR1 logs, or alternatives 1h 79 ms 76 ms ⚪ -4% 59 ms 1.29× ✅ same
⚪ OR2 logs, negated or alternatives 1h 72 ms 67 ms ⚪ -7% 40 ms 1.68× ✅ same
⚪ OR3 logs, regexp or alternatives 1h 62 ms 64 ms ⚪ +3% 61 ms 1.05× ✅ same
⚪ OR4 count by level, or alternatives with parser 1h 82 ms 85 ms ⚪ +4% 30 ms 2.83× ✅ same
⚪ OR5 rate, negated regexp or alternatives 1h 54 ms 55 ms ⚪ +2% 83 ms 0.66× ✅ same
⚪ OR6 instant, or alternatives instant 7 ms 6 ms ⚪ -14% 57 ms 0.11× ✅ same
⚪ PR1 count by level, parenthesised json 1h 174 ms 180 ms ⚪ +3% 44 ms 4.09× ✅ same
⚪ PR2 rate, parenthesised line filter 1h 50 ms 46 ms ⚪ -8% 63 ms 0.73× ✅ same
⚪ PR3 bytes by app, parenthesised regexp 1h 55 ms 52 ms ⚪ -5% 67 ms 0.78× ✅ same
⚪ PR4 count by level, parenthesised parser, offset 1h 203 ms 194 ms ⚪ -4% 43 ms 4.51× ✅ same
⚪ PR5 rate by app, pipeline after the range 1h 215 ms 226 ms ⚪ +5% 112 ms 2.02× ✅ same
⚪ PR6 doubly parenthesised range 1h 46 ms 49 ms ⚪ +7% 61 ms 0.80× ✅ same
⚪ PR7 instant, parenthesised line filter instant 6 ms 6 ms ⚪ +0% 59 ms 0.10× ✅ same
⚪ P1 logs, json, level equals 1h 137 ms 138 ms ⚪ +1% 83 ms 1.66× ✅ same
⚪ P2 logs, logfmt, level not equal 1h 30 ms 32 ms ⚪ +7% 4 ms 8.00× ✅ same
⚪ P3 logs, json, level existence 1h 123 ms 124 ms ⚪ +1% 65 ms 1.91× ✅ same
⚪ P4 logfmt count by level 1h 31 ms 35 ms ⚪ +13% 6 ms 5.83× ✅ same
⚪ P5 json count by level 1h 81 ms 78 ms ⚪ -4% 14 ms 5.57× ✅ same
⚪ P6 json count, level filter 1h 15 ms 16 ms ⚪ +7% 13 ms 1.23× ✅ same
⚪ P7 json rate by level, level regexp 1h 16 ms 18 ms ⚪ +12% 13 ms 1.38× ✅ same
⚪ P8 json count by a name that is no stream label 1h 86 ms 84 ms ⚪ -2% 12 ms 7.00× ✅ same
⚪ P9 instant logfmt by level instant 5 ms 6 ms ⚪ +20% 9 ms 0.67× ✅ same
⚪ E1 json duration_ms sum by service 1h 84 ms 84 ms ⚪ +0% 15 ms 5.60× ➖ differs (as base)
⚪ E2 json duration_ms p95 by service 1h 439 ms 424 ms ⚪ -3% 14 ms 30× ✅ same
⚪ E3 logfmt latency_ms rate, production 1h 499 ms 493 ms ⚪ -1% 125 ms 3.94× ➖ differs (as base)
⚪ E4 logfmt size_bytes max by service 1h 43 ms 47 ms ⚪ +9% 15 ms 3.13× ➖ differs (as base)
⚪ E5 json duration_ms sum, instant instant 34 ms 36 ms ⚪ +6% 25 ms 1.44× ✅ same
⚪ E6 logfmt ttl unit string (Loki 400) 1h 400 400 ⚪ +5% 400 — ✅ same
⚪ E7 json hexadecimal trace_id (Loki 400) 1h 400 400 ⚪ +2% 400 — ✅ same
⚪ E8 json duration_ms sum by service, namespace prod 1h 193 ms 187 ms ⚪ -3% 78 ms 2.40× ➖ differs (as base)
⚪ E9 logfmt latency_ms sum by service, namespace prod 1h 302 ms 302 ms ⚪ +0% 94 ms 3.21× ➖ differs (as base)
⚪ U1 logfmt amount rate 1h 37 ms 36 ms ⚪ -3% 12 ms 3.00× ✅ same
⚪ U2 json duration_ms rate 1h 86 ms 88 ms ⚪ +2% 23 ms 3.83× ✅ same
⚪ U3 json duration_ms rate, error filter 1h 87 ms 86 ms ⚪ -1% 27 ms 3.19× ✅ same
⚪ U4 logfmt latency_ms rate, production 1h 346 ms 343 ms ⚪ -1% 125 ms 2.74× ➖ differs (as base)
⚪ U5 logfmt amount rate, instant instant 7 ms 8 ms ⚪ +14% 11 ms 0.73× ✅ same
⚪ U6 json duration_ms rate, instant instant 12 ms 13 ms ⚪ +8% 19 ms 0.68× ✅ same
⚪ U7 json duration_ms sum_over_time, instant instant 14 ms 15 ms ⚪ +7% 19 ms 0.79× ✅ same
⚪ U8 logfmt amount rate by service (grouped) 1h 42 ms 42 ms ⚪ +0% 12 ms 3.50× ✅ same
⚪ U9 logfmt amount rate_counter (folded per series) 1h 286 ms 288 ms ⚪ +1% 32 ms 9.00× ➖ differs (as base)
⚪ U1 json duration_ms sum by service 1h 86 ms 86 ms ⚪ +0% 14 ms 6.14× ➖ differs (as base)
⚪ U10 instant sum_over_time unwrap instant 34 ms 37 ms ⚪ +9% 29 ms 1.28× ✅ same
⚪ U11 instant max_over_time missing label instant 5 ms 5 ms ⚪ +0% 12 ms 0.42× ✅ same
⚪ U12 json duration_ms over every service 1h 237 ms 234 ms ⚪ -1% 41 ms 5.71× ➖ differs (as base)
⚪ U13 logfmt latency_ms over every service 1h 506 ms 507 ms ⚪ +0% 57 ms 8.89× ➖ differs (as base)
⚪ U14 duration() of a unit string 1h 46 ms 44 ms ⚪ -4% 7 ms 6.29× ➖ differs (as base)
⚪ U2 json duration_ms max by service 1h 96 ms 97 ms ⚪ +1% 38 ms 2.55× ➖ differs (as base)
⚪ U3 json duration_ms sliding sum 1h 85 ms 84 ms ⚪ -1% 31 ms 2.71× ➖ differs (as base)
⚪ U4 logfmt size_bytes sum by service 1h 39 ms 39 ms ⚪ +0% 6 ms 6.50× ➖ differs (as base)
⚪ U5 logfmt ttl unit string (no sample) 1h 38 ms 39 ms ⚪ +3% 6 ms 6.50× ✅ same
⚪ U6 missing label, no parser 1h 20 ms 20 ms ⚪ +0% 9 ms 2.22× ✅ same
⚪ U7 missing label, ungrouped sum 1h 18 ms 18 ms ⚪ +0% 9 ms 2.00× ✅ same
⚪ U8 rate of an unwrapped label 1h 87 ms 87 ms ⚪ +0% 14 ms 6.21× ✅ same
⚪ U9 bytes() conversion 1h 52 ms 50 ms ⚪ -4% 11 ms 4.55× ➖ differs (as base)
Cold (first-run) timings — what a user opening a panel sees
shape range base cold PR cold Loki cold PR ÷ Loki cold
bytes_over_time by app 1h 72 ms 67 ms 736 ms 0.09×
drilldown service landing 1h 35 ms 33 ms 548 ms 0.06×
instant json filtered instant 398 ms 392 ms 71 ms 5.52×
instant json volume instant 437 ms 434 ms 93 ms 4.67×
instant ungrouped rate instant 6 ms 7 ms 75 ms 0.09×
json rate by level (no filter, no drop) 1h 400 400 400 —
json volume no filters 1h 194 ms 192 ms 3 ms 64.00×
logfmt count by level, filter, drop 1h 442 ms 444 ms 1.02 s 0.44×
logfmt volume 1h 240 ms 233 ms 1.09 s 0.21×
logs plain 1h 97 ms 69 ms 40 ms 1.73×
logs | json 1h 105 ms 101 ms 62 ms 1.63×
logs | logfmt 1h 163 ms 172 ms 50 ms 3.44×
stream-label count by app 1h 24 ms 29 ms 643 ms 0.05×
topk rate by app 1h 56 ms 47 ms 681 ms 0.07×
ungrouped rate 1h 11 ms 11 ms 567 ms 0.02×
DB1 label breakdown pod 1h 99 ms 105 ms 731 ms 0.14×
DB2 label breakdown namespace 1h 21 ms 15 ms 647 ms 0.02×
DB3 json field breakdown user_id 1h 51 ms 49 ms 524 ms 0.09×
DB4 json field breakdown batch_id 1h 97 ms 99 ms 598 ms 0.17×
X1 json filter level_extracted, by level 1h 3.53 s 3.54 s 659 ms 5.37×
X2 json group by level_extracted 1h 316 ms 318 ms 792 ms 0.40×
X3 json rate, level_extracted equality 1h 293 ms 286 ms 509 ms 0.56×
X4 json bytes, level_extracted regexp 1h 405 ms 421 ms 649 ms 0.65×
X5 logfmt filter level_extracted, by level 1h 695 ms 695 ms 903 ms 0.77×
E1 logs, json parser over stream labels 1h 145 ms 143 ms 68 ms 2.10×
E2 logs, logfmt parser over stream labels 1h 78 ms 72 ms 52 ms 1.38×
E3 logs, json, existence filter on level_extracted 1h 149 ms 160 ms 69 ms 2.32×
E4 logs, logfmt, existence filter on level_extracted 1h 96 ms 86 ms 149 ms 0.58×
E5 logs, json, drop level_extracted 1h 130 ms 112 ms 73 ms 1.53×
E6 logfmt count by level_extracted 1h 49 ms 45 ms 38 ms 1.18×
E7 json count by level_extracted 1h 1.40 s 1.38 s 141 ms 9.80×
E8 instant logfmt by level_extracted instant 7 ms 7 ms 9 ms 0.78×
A explore volume, 2 filters, drop 1h 2.84 s 1.61 s 1.15 s 1.40×
B grouped sum, filter, no drop 1h 124 ms 120 ms 851 ms 0.14×
C ungrouped sum, filter, no drop 1h 126 ms 119 ms 472 ms 0.25×
D volume, no filters 1h 204 ms 208 ms 861 ms 0.24×
E field breakdown pipeline (explore) 1h 125 ms 109 ms 516 ms 0.21×
F field breakdown service_version (explore) 1h 1.32 s 1.34 s 569 ms 2.36×
G field breakdown pipeline (drilldown) 1h 44 ms 43 ms 513 ms 0.08×
H field breakdown service_version (drilldown) 1h 122 ms 124 ms 544 ms 0.23×
I grafana volume of B 1h 109 ms 108 ms 595 ms 0.18×
O2 explore log volume (Grafana form), underscore structured-metadata filter 1h 173 ms 149 ms 494 ms 0.30×
DL1 drilldown field breakdown json-expr, level filter 1h 496 ms 683 ms 480 ms 1.42×
DL2 drilldown field breakdown, level + stream-label filter before json 1h 87 ms 85 ms 25 ms 3.40×
DL3 drilldown logfmt field breakdown, level filter 1h 614 ms 637 ms 887 ms 0.72×
DL4 instant count, level filter, json+logfmt, 1h instant 515 ms 504 ms 1.22 s 0.41×
DL6 explore volume, level filter before json 1h 1.04 s 1.03 s 689 ms 1.49×
OR1 logs, or alternatives 1h 86 ms 78 ms 60 ms 1.30×
OR2 logs, negated or alternatives 1h 81 ms 70 ms 41 ms 1.71×
OR3 logs, regexp or alternatives 1h 58 ms 62 ms 59 ms 1.05×
OR4 count by level, or alternatives with parser 1h 126 ms 122 ms 505 ms 0.24×
OR5 rate, negated regexp or alternatives 1h 54 ms 57 ms 570 ms 0.10×
OR6 instant, or alternatives instant 6 ms 7 ms 56 ms 0.12×
PR1 count by level, parenthesised json 1h 211 ms 196 ms 756 ms 0.26×
PR2 rate, parenthesised line filter 1h 48 ms 47 ms 417 ms 0.11×
PR3 bytes by app, parenthesised regexp 1h 49 ms 52 ms 552 ms 0.09×
PR4 count by level, parenthesised parser, offset 1h 196 ms 198 ms 685 ms 0.29×
PR5 rate by app, pipeline after the range 1h 225 ms 222 ms 877 ms 0.25×
PR6 doubly parenthesised range 1h 60 ms 45 ms 418 ms 0.11×
PR7 instant, parenthesised line filter instant 6 ms 6 ms 55 ms 0.11×
P1 logs, json, level equals 1h 164 ms 145 ms 206 ms 0.70×
P2 logs, logfmt, level not equal 1h 35 ms 29 ms 34 ms 0.85×
P3 logs, json, level existence 1h 127 ms 119 ms 67 ms 1.78×
P4 logfmt count by level 1h 39 ms 41 ms 45 ms 0.91×
P5 json count by level 1h 92 ms 93 ms 143 ms 0.65×
P6 json count, level filter 1h 14 ms 14 ms 229 ms 0.06×
P7 json rate by level, level regexp 1h 16 ms 18 ms 147 ms 0.12×
P8 json count by a name that is no stream label 1h 96 ms 95 ms 120 ms 0.79×
P9 instant logfmt by level instant 5 ms 4 ms 9 ms 0.44×
E1 json duration_ms sum by service 1h 102 ms 85 ms 156 ms 0.54×
E2 json duration_ms p95 by service 1h 423 ms 431 ms 174 ms 2.48×
E3 logfmt latency_ms rate, production 1h 492 ms 497 ms 948 ms 0.52×
E4 logfmt size_bytes max by service 1h 44 ms 45 ms 173 ms 0.26×
E5 json duration_ms sum, instant instant 32 ms 33 ms 25 ms 1.32×
E6 logfmt ttl unit string (Loki 400) 1h 400 400 400 —
E7 json hexadecimal trace_id (Loki 400) 1h 400 400 400 —
E8 json duration_ms sum by service, namespace prod 1h 197 ms 186 ms 533 ms 0.35×
E9 logfmt latency_ms sum by service, namespace prod 1h 300 ms 303 ms 716 ms 0.42×
U1 logfmt amount rate 1h 55 ms 37 ms 48 ms 0.77×
U2 json duration_ms rate 1h 85 ms 85 ms 128 ms 0.66×
U3 json duration_ms rate, error filter 1h 86 ms 87 ms 176 ms 0.49×
U4 logfmt latency_ms rate, production 1h 346 ms 338 ms 989 ms 0.34×
U5 logfmt amount rate, instant instant 8 ms 7 ms 11 ms 0.64×
U6 json duration_ms rate, instant instant 13 ms 12 ms 21 ms 0.57×
U7 json duration_ms sum_over_time, instant instant 15 ms 14 ms 19 ms 0.74×
U8 logfmt amount rate by service (grouped) 1h 41 ms 39 ms 54 ms 0.72×
U9 logfmt amount rate_counter (folded per series) 1h 286 ms 286 ms 277 ms 1.03×
U1 json duration_ms sum by service 1h 104 ms 83 ms 159 ms 0.52×
U10 instant sum_over_time unwrap instant 36 ms 38 ms 26 ms 1.46×
U11 instant max_over_time missing label instant 5 ms 5 ms 14 ms 0.36×
U12 json duration_ms over every service 1h 236 ms 255 ms 700 ms 0.36×
U13 logfmt latency_ms over every service 1h 530 ms 654 ms 909 ms 0.72×
U14 duration() of a unit string 1h 48 ms 44 ms 39 ms 1.13×
U2 json duration_ms max by service 1h 99 ms 95 ms 835 ms 0.11×
U3 json duration_ms sliding sum 1h 80 ms 83 ms 176 ms 0.47×
U4 logfmt size_bytes sum by service 1h 40 ms 37 ms 43 ms 0.86×
U5 logfmt ttl unit string (no sample) 1h 42 ms 39 ms 40 ms 0.97×
U6 missing label, no parser 1h 19 ms 21 ms 67 ms 0.31×
U7 missing label, ungrouped sum 1h 18 ms 18 ms 66 ms 0.27×
U8 rate of an unwrapped label 1h 102 ms 87 ms 154 ms 0.56×
U9 bytes() conversion 1h 61 ms 62 ms 42 ms 1.48×
Why these shapes
  • internal/translator/translator.go → 90: control/bytes_over_time by app, control/instant json filtered, control/instant json volume, control/instant ungrouped rate, control/json rate by level (no filter, no drop), control/json volume no filters, control/logfmt count by level, filter, drop, control/logfmt volume …
  • internal/proxy/metric_agg.go → 22: control/bytes_over_time by app, control/instant json volume, control/instant ungrouped rate, control/json volume no filters, control/stream-label count by app, control/topk rate by app, control/ungrouped rate, drilldown-breakdown-exact/DB1 label breakdown pod …
  • internal/proxy/range_metric_compat.go → 12: control/bytes_over_time by app, control/instant json volume, control/instant ungrouped rate, control/json volume no filters, control/stream-label count by app, control/topk rate by app, control/ungrouped rate, json-filter-pushdown/A explore volume, 2 filters, drop …
  • internal/proxy/vector_matching.go → 10: control/stream-label count by app, unwrap-ungrouped-sum/U1 logfmt amount rate, unwrap-ungrouped-sum/U2 json duration_ms rate, unwrap-ungrouped-sum/U3 json duration_ms rate, error filter, unwrap-ungrouped-sum/U4 logfmt latency_ms rate, production, unwrap-ungrouped-sum/U5 logfmt amount rate, instant, unwrap-ungrouped-sum/U6 json duration_ms rate, instant, unwrap-ungrouped-sum/U7 json duration_ms sum_over_time, instant …
  • control smoke → 8: control/drilldown service landing, control/instant ungrouped rate, control/json rate by level (no filter, no drop), control/json volume no filters, control/logs plain, control/logs | json, control/stream-label count by app, control/topk rate by app
  • internal/proxy/proxy.go (endpoint handler) → 8: control/drilldown service landing, control/instant ungrouped rate, control/json rate by level (no filter, no drop), control/json volume no filters, control/logs plain, control/logs | json, control/stream-label count by app, control/topk rate by app
  • internal/logql/canonical.go → 7: parenthesized-range-or-filters/PR1 count by level, parenthesised json, parenthesized-range-or-filters/PR2 rate, parenthesised line filter, parenthesized-range-or-filters/PR3 bytes by app, parenthesised regexp, parenthesized-range-or-filters/PR4 count by level, parenthesised parser, offset, parenthesized-range-or-filters/PR5 rate by app, pipeline after the range, parenthesized-range-or-filters/PR6 doubly parenthesised range, parenthesized-range-or-filters/PR7 instant, parenthesised line filter

base b20a550f6f → PR 89e7aff46d · 4 runs (first is cold), warm p50 · ranges 1h · noise ±30% and 100 ms · VictoriaLogs restarts 0→0 · 10.4 min. Same runner, one fresh stack, targets interleaved per request. How to read and reproduce: bench/ab/README.md.

Comment thread internal/proxy/binary_aggregation.go Fixed
@github-actions

github-actions Bot commented Oct 12, 2026 •

Copy link
Copy Markdown
Contributor

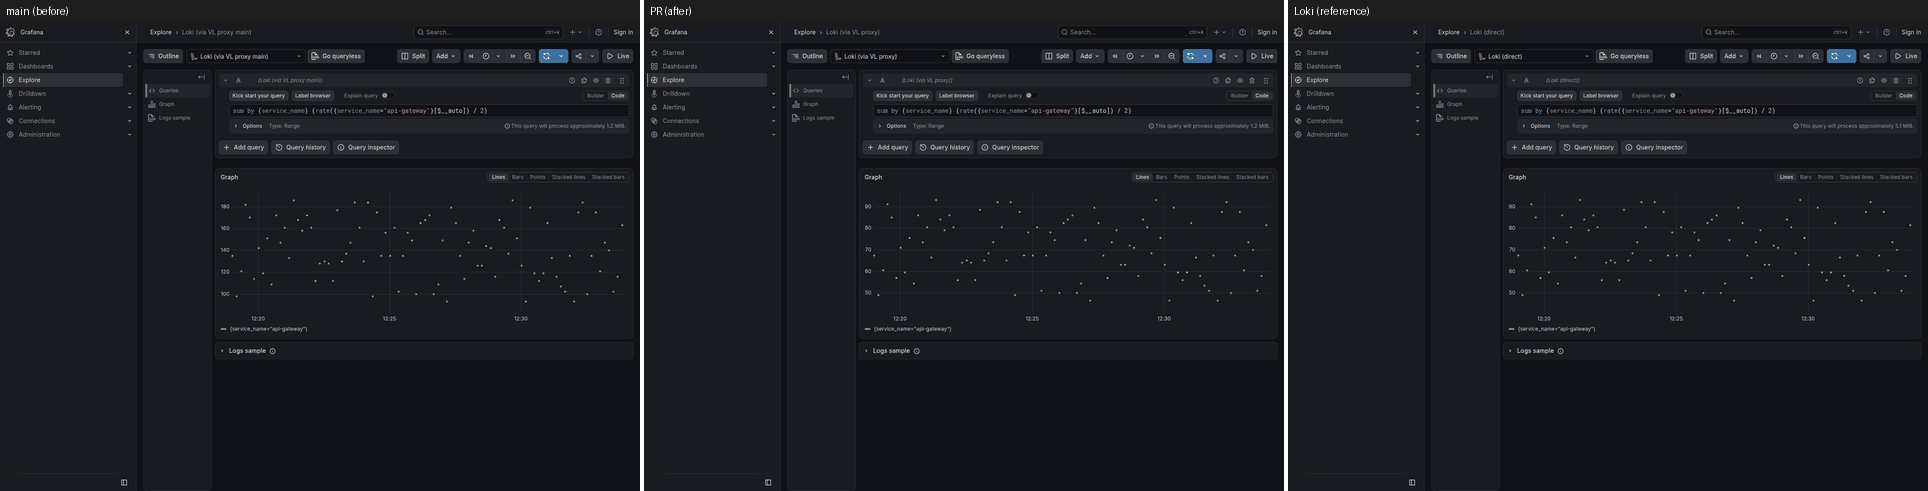
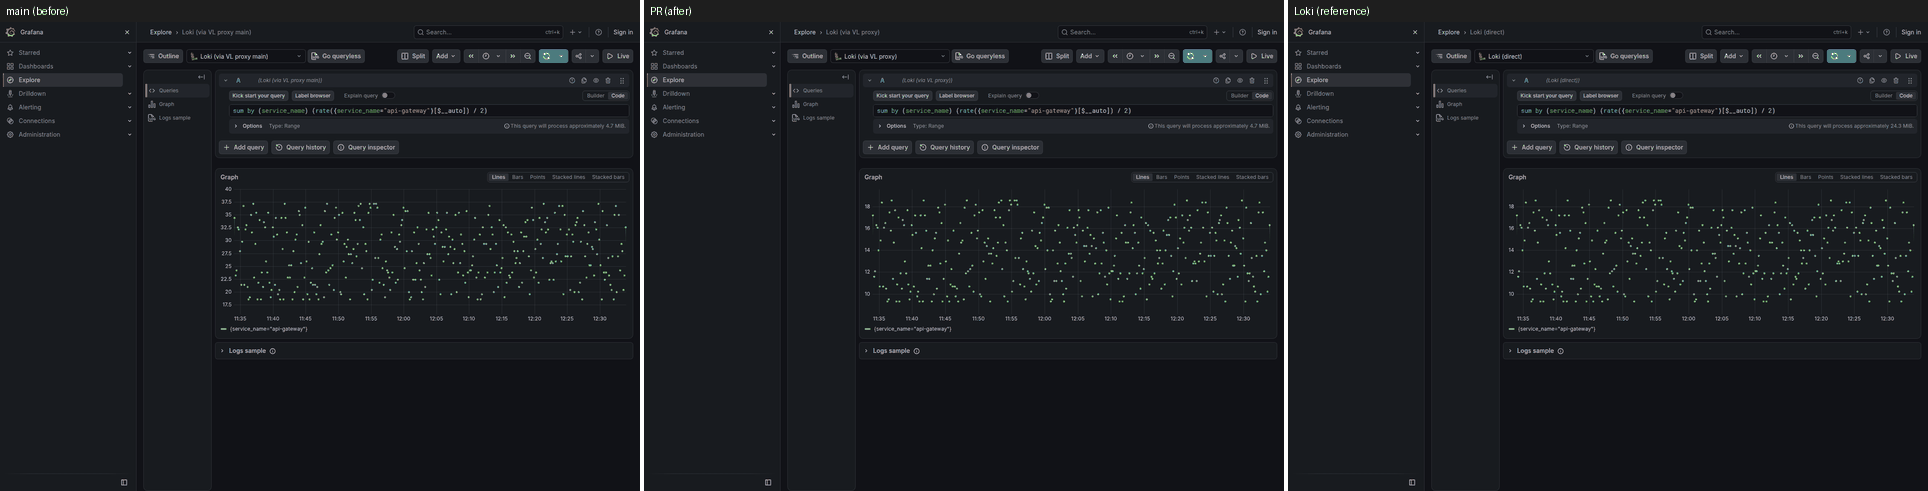
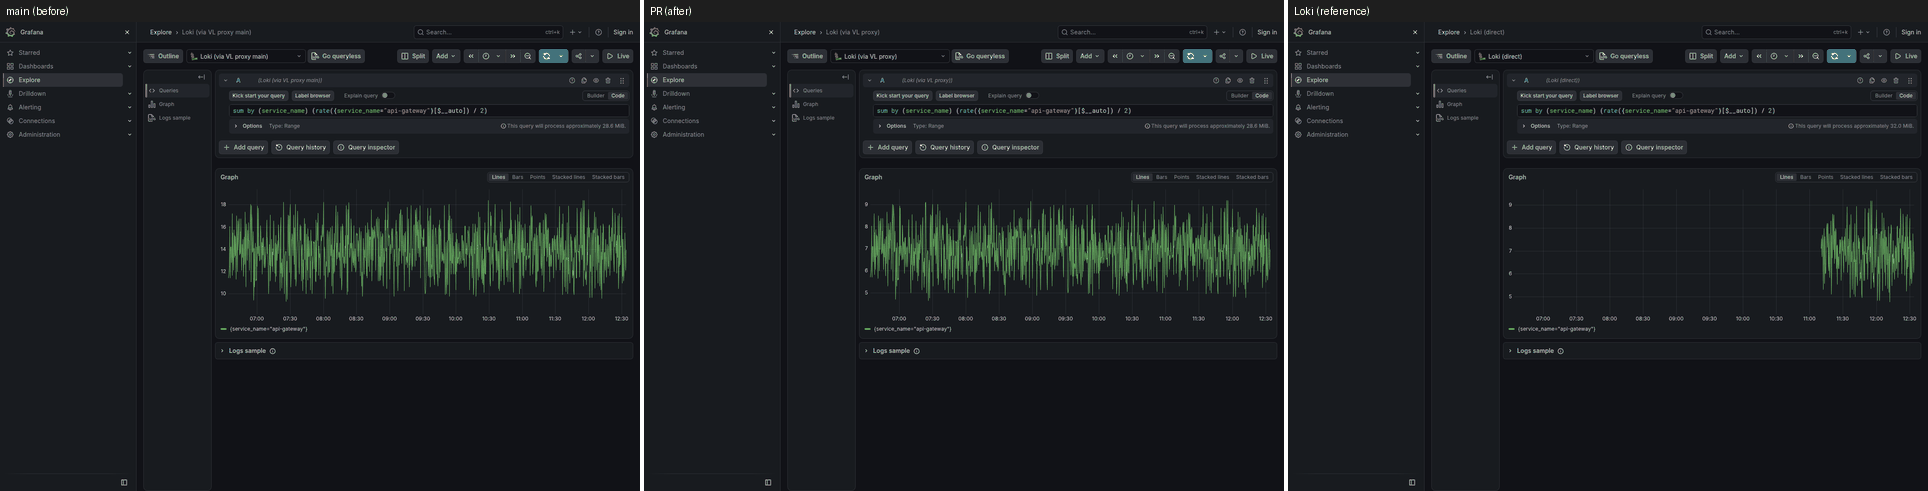
✅ Visual smoke: passed with warnings

Base b20a550f6f vs PR 20b4391723, Grafana through the proxy builds and Loki on one fresh stack; run.
Loaded again, once and more patiently, after a first-pass difference or an unsettled page: explore-sum-by-over-binary 15m, explore-sum-by-over-binary 1h, explore-sum-by-over-binary 6h.
Core set: 5 capture(s) at 1h. Detailed set: 27 entries (explore-sum-by-over-binary, explore-metric-plain, explore-A, explore-B, explore-C, explore-E, explore-F, explore-logs-json, ...). 35 capture(s), 15m/1h/6h, 24h and 7d stay out of PR runs.
Trimmed to the 1h range for the capture budget: explore-A, explore-B, explore-C, explore-E, explore-F, explore-logs-json, explore-logfmt-metric, explore-logs-extracted, explore-extracted-metric, explore-extracted-filter-metric, explore-extracted-group-metric, explore-logs-plain-level, explore-plain-level-metric, explore-metric-parenthesized, explore-logs-line-filter-or, explore-metric-line-filter-or, explore-unwrap-sum, explore-unwrap-unit-string, explore-unwrap-missing-label, explore-unwrap-conversion-error, explore-unwrap-rate-sum, dd-labels-namespace, dd-field-service_version, dd-field-pipeline.

Fix proof

Captures of the exact cases this pull request adds or fixes (registry case, base | PR | Loki). The verdict compares the PR with Loki where the base did not match. The gate fails a case unless one capture is fixed or improved, or, beyond the Loki data window, the base failed where Loki and the PR both answered with data (the label does not excuse it; only visual: none on the case does).

semantics/aggregation-over-binary-dropped: 🟡 improved

page range base = PR (data) vs Loki (PR) verdict
explore-sum-by-over-binary 15m differs (1) 1 difference(s), 1 on base too 🟡 improved
explore-sum-by-over-binary 1h differs (1) 1 difference(s), 1 on base too 🟡 improved
explore-sum-by-over-binary 6h differs (1) n/a (beyond the Loki window) ⚪ undecided
explore-sum-by-over-binary-15m: improved

explore-sum-by-over-binary-15m

explore-sum-by-over-binary-1h: improved

explore-sum-by-over-binary-1h

explore-sum-by-over-binary-6h: undecided

explore-sum-by-over-binary-6h

  • semantics/instant-result-type-missing: no visual proof, exempt: instant queries only; the visual harness captures Explore range panels (queryType range), so the fix is proven by the instant resultType table and the e2e against Loki
  • semantics/label-replace-new-label: no visual proof, exempt: the visible difference is on instant queries; the visual harness captures Explore range panels (queryType range), where label_replace already matched, so the fix is proven by the instant tests and the

Regression check

page range set base = PR (data) vs Loki (PR) pixel diff result
dd-fields 1h core ✅ identical identical (4 explained, 1 history-dependent) 0.12% ✅
dd-landing 1h core ✅ identical identical (3 explained) 0.13% ✅
dd-service-logs 1h core ✅ identical identical (3 explained, 1 history-dependent) 0.12% ✅
explore-logs-plain 1h core ✅ identical identical (1 explained) 0.07% ✅
explore-metric-plain 1h core ✅ identical identical (1 explained) 0.04% ✅
dd-field-pipeline 1h detailed ✅ identical identical (3 explained, 1 history-dependent) 0.12% ✅
dd-field-service_version 1h detailed ✅ identical identical (3 explained, 1 history-dependent) 0.12% ✅
dd-labels-namespace 1h detailed ✅ identical identical (3 explained, 1 history-dependent) 0.12% ✅
explore-A 1h detailed ✅ identical identical (1 explained) 0.04% ✅
explore-B 1h detailed ✅ identical identical (1 explained) 0.04% ✅
explore-C 1h detailed ✅ identical identical (1 explained) 0.04% ✅
explore-E 1h detailed ✅ identical identical (1 explained) 0.04% ✅
explore-F 1h detailed ✅ identical identical (1 explained) 0.04% ✅
explore-extracted-filter-metric 1h detailed ✅ identical identical (1 explained) 0.04% ✅
explore-extracted-group-metric 1h detailed ✅ identical identical (1 explained) 0.04% ✅
explore-extracted-metric 1h detailed ✅ identical identical (1 explained) 0.04% ✅
explore-logfmt-metric 1h detailed ✅ identical identical (1 explained) 0.04% ✅
explore-logs-extracted 1h detailed ✅ identical identical (1 explained) 0.07% ✅
explore-logs-json 1h detailed ✅ identical identical (1 explained) 0.07% ✅
explore-logs-line-filter-or 1h detailed ✅ identical identical (1 explained) 0.07% ✅
explore-logs-plain-level 1h detailed ✅ identical identical (2 explained) 0.07% ✅
explore-metric-line-filter-or 1h detailed ✅ identical identical (1 explained) 0.04% ✅
explore-metric-parenthesized 1h detailed ✅ identical identical (1 explained) 0.04% ✅
explore-metric-plain 15m detailed ✅ identical identical (1 explained) 0.04% ✅
explore-metric-plain 6h detailed ✅ identical n/a (beyond the Loki window) 0.04% ✅
explore-plain-level-metric 1h detailed ✅ identical identical (1 explained) 0.04% ✅
explore-sum-by-over-binary 15m detailed differs (1): query ('sum by (service_name) (rate({service_name="api-gatew 1 difference(s), 1 on base too 0.28% ✅ improved (closer to Loki)
explore-sum-by-over-binary 1h detailed differs (1): query ('sum by (service_name) (rate({service_name="api-gatew 1 difference(s), 1 on base too 1.11% ✅ improved (closer to Loki)
explore-sum-by-over-binary 6h detailed differs (1): query ('sum by (service_name) (rate({service_name="api-gatew n/a (beyond the Loki window) 4.82% ✅ improved (closer to Loki)
explore-unwrap-conversion-error 1h detailed ✅ identical identical (1 explained) 0.04% ✅
explore-unwrap-missing-label 1h detailed ✅ identical identical (1 explained) 0.04% ✅
explore-unwrap-rate-sum 1h detailed ✅ identical identical (1 explained) 0.04% ✅
explore-unwrap-sum 1h detailed ✅ identical 1 difference(s), 1 on base too; 1 explained 0.04% ✅
explore-unwrap-unit-string 1h detailed ✅ identical identical (1 explained) 0.04% ✅
tail-json-filter live detailed ✅ identical entries in the window: PR 1904, Loki 679, in both 679 5.51% ✅

Gate: a base-vs-PR data difference passes when the PR is closer to Loki, and fails when the PR diverges from Loki or Loki cannot decide it (at a range Loki does not hold, a difference passes when the same page proved it closer to Loki at a shorter range; otherwise label the pull request visual-change-expected to accept an intended change). Also failing: a panel empty on the PR but not on the base, an error banner, panel error, error answer or new "No data" panel on the PR, a PR side that never settled, a difference that did not reproduce on the recapture. Pixel differences only warn.

explore-sum-by-over-binary-6h: no Loki data at this range; the same differences match Loki at a shorter range (1): query ('sum by (service_name) (rate(
  • no Loki data at this range; the same differences match Loki at a shorter range (1): query ('sum by (service_name) (rate({service_name="api-gateway"}[$__auto]) / 2)', 'range', '1791: {"service_name": "api-gateway"}: value at 1791786840000: 11.4
  • pixel diff 4.8%

explore-sum-by-over-binary-6h

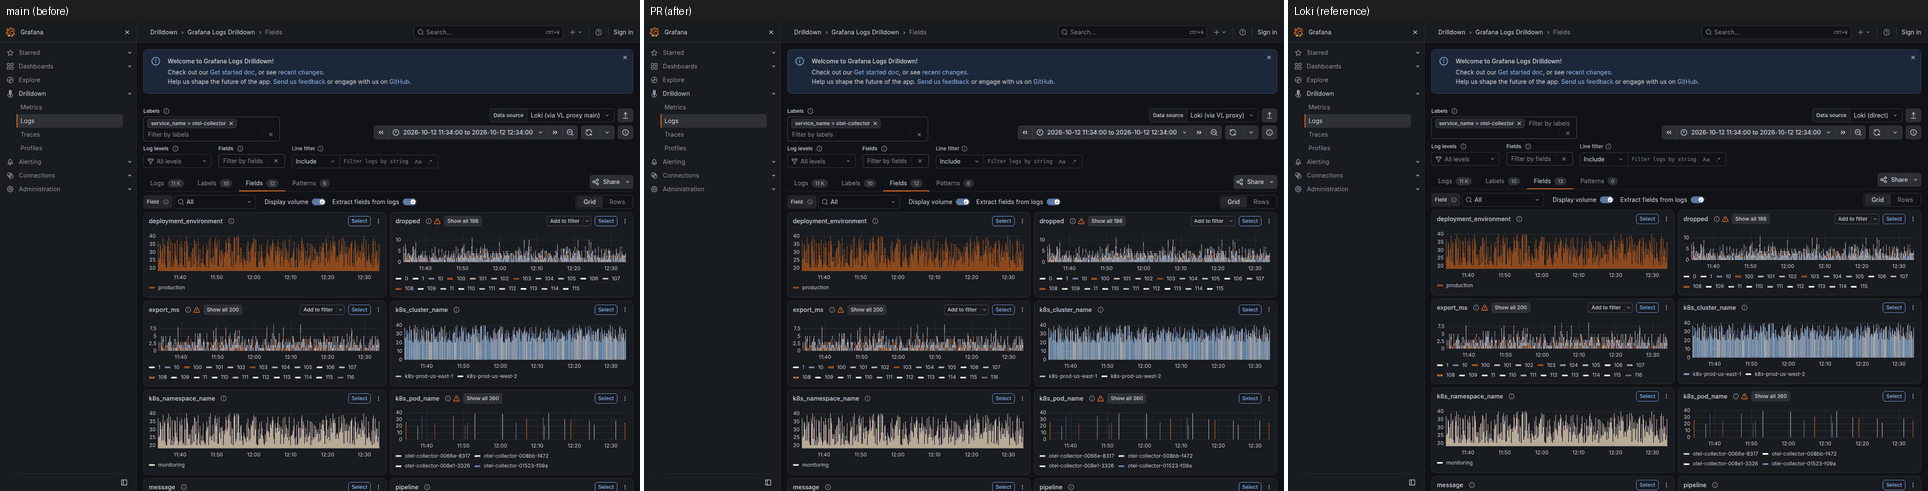
Core set montages (5): base | PR | Loki

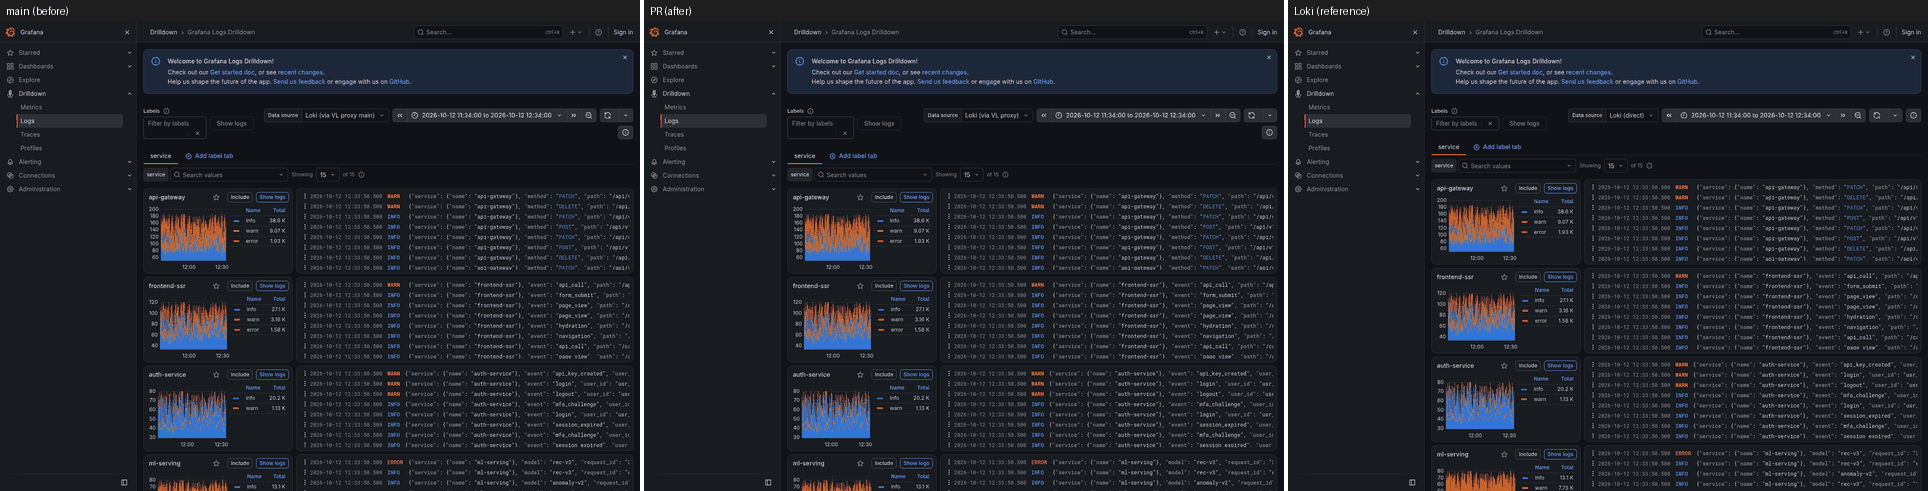
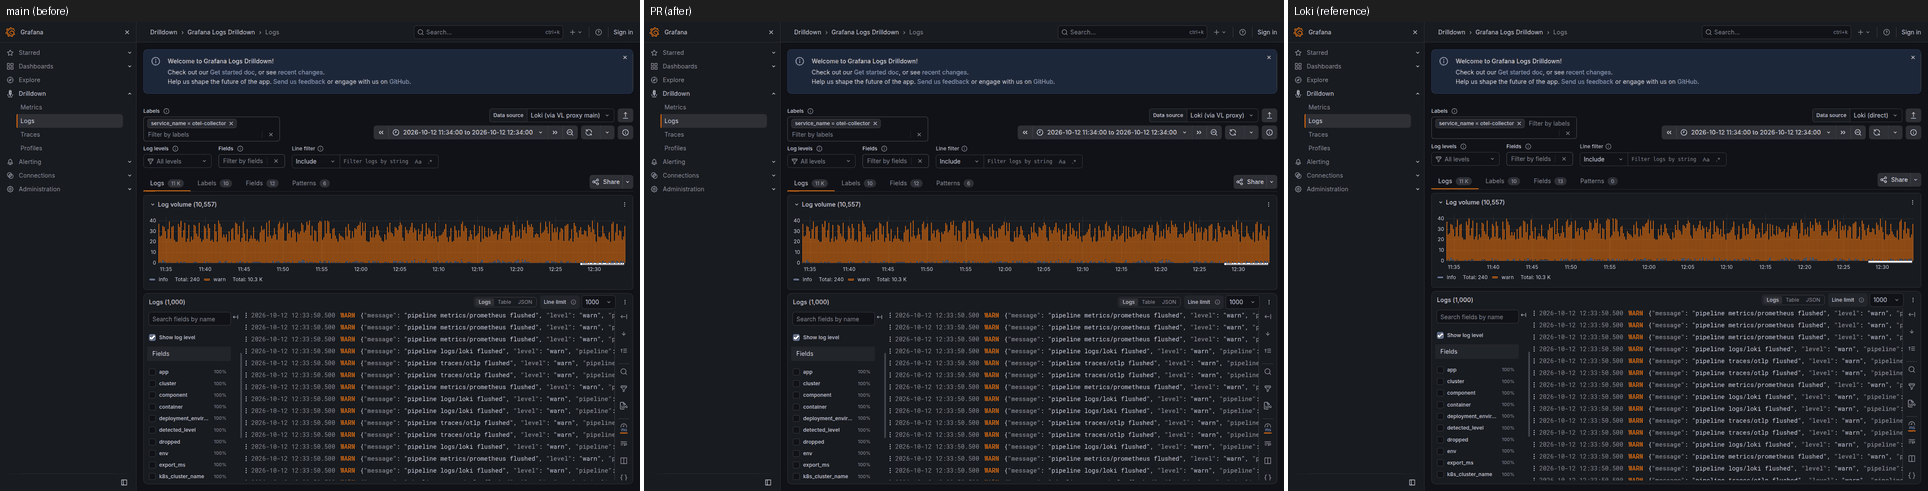
dd-fields-1h

dd-fields-1h

dd-landing-1h

dd-landing-1h

dd-service-logs-1h

dd-service-logs-1h

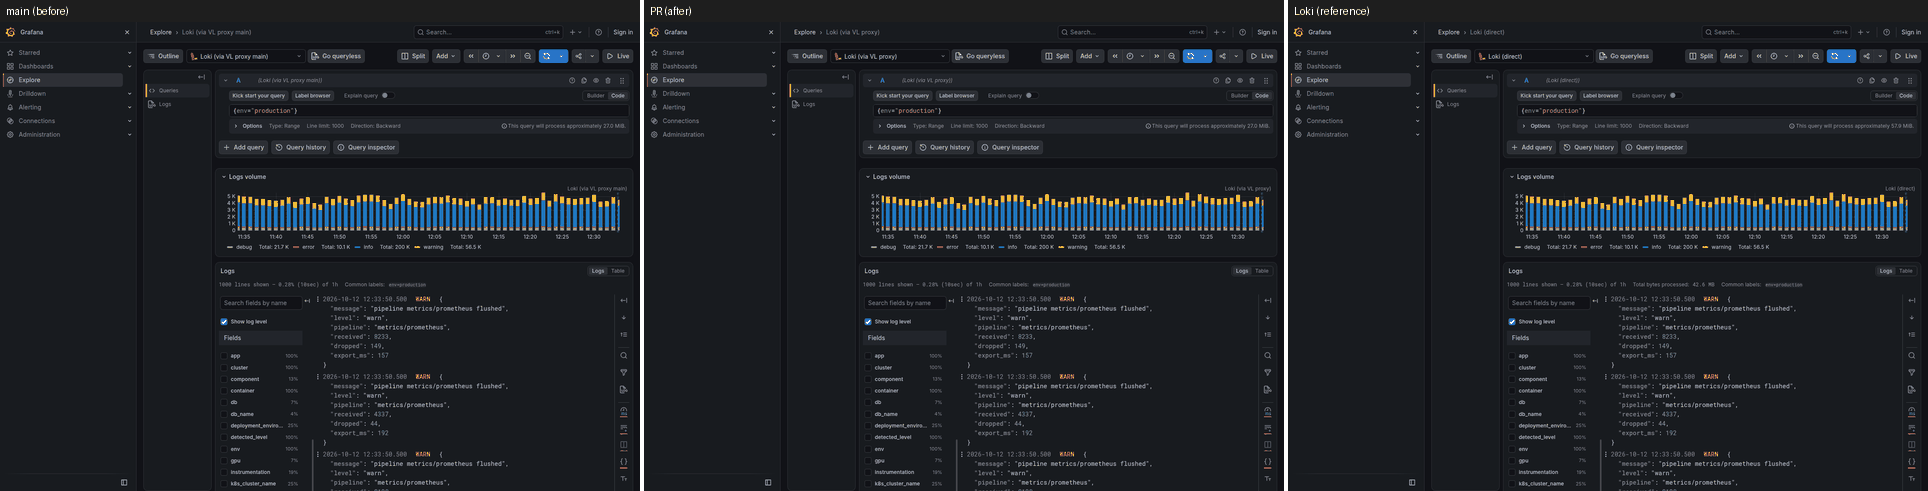
explore-logs-plain-1h

explore-logs-plain-1h

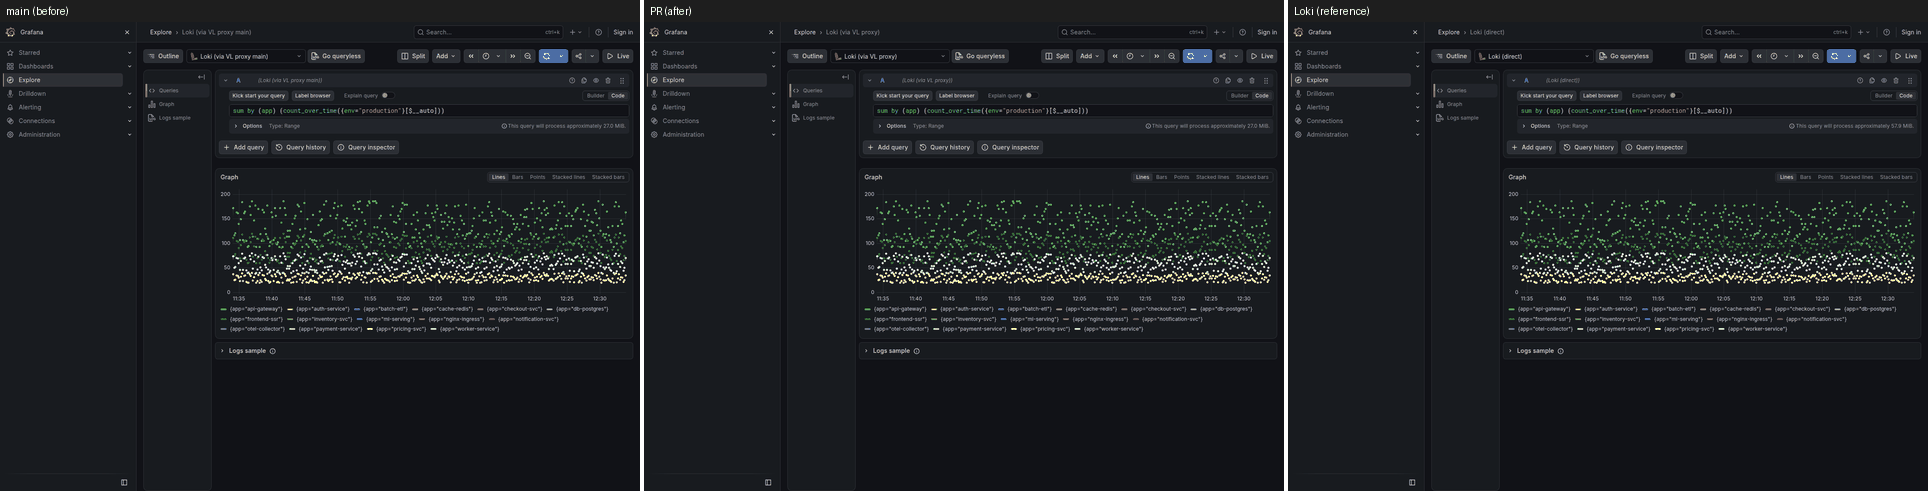
explore-metric-plain-1h

explore-metric-plain-1h

All montages of this run: pr-visuals/pr-741.

@github-actions

github-actions Bot commented Oct 12, 2026 •

Copy link
Copy Markdown
Contributor

PR Quality Report

Compared against base branch main.

Coverage and tests

Signal Base PR Delta
Test count 8648 9820 1172
Coverage 87.6% 88.0% +0.5% (improved)

Compatibility

Track Base PR Delta
Loki API 100.0% 11/11 (100.0%) 0.0% (stable)
Logs Drilldown 100.0% 17/17 (100.0%) 0.0% (stable)
VictoriaLogs 100.0% 11/11 (100.0%) 0.0% (stable)

Performance smoke

Lower CPU cost (ns/op) is better. Lower benchmark memory cost (B/op, allocs/op) is better. Higher throughput is better. Lower load-test memory growth is better. Benchmark rows are medians from repeated samples.

Signal Base PR Delta
QueryRange cache-hit CPU cost 2771.0 ns/op 2733.0 ns/op -1.4% (stable)
QueryRange cache-hit memory 1240.0 B/op 1240.0 B/op 0.0% (stable)
QueryRange cache-hit allocations 27.0 allocs/op 27.0 allocs/op 0.0% (stable)
QueryRange cache-bypass CPU cost 3262.0 ns/op 3327.0 ns/op +2.0% (stable)
QueryRange cache-bypass memory 1289.0 B/op 1290.0 B/op +0.1% (stable)
QueryRange cache-bypass allocations 27.0 allocs/op 27.0 allocs/op 0.0% (stable)
Labels cache-hit CPU cost 807.3 ns/op 852.0 ns/op +5.5% (stable)
Labels cache-hit memory 48.0 B/op 48.0 B/op 0.0% (stable)
Labels cache-hit allocations 3.0 allocs/op 3.0 allocs/op 0.0% (stable)
Labels cache-bypass CPU cost 1341.0 ns/op 1383.0 ns/op +3.1% (stable)
Labels cache-bypass memory 398.0 B/op 398.0 B/op 0.0% (stable)
Labels cache-bypass allocations 14.0 allocs/op 14.0 allocs/op 0.0% (stable)

State

  • Coverage, compatibility, and sampled performance are reported here from the same PR workflow.
  • This is a delta report, not a release gate by itself. Required checks still decide merge safety.
  • Performance is a smoke comparison, not a full benchmark lab run.
  • Delta states use the same noise guards as the quality gate (percent + absolute + low-baseline checks), so report labels match merge-gate behavior.

szibis added a commit that referenced this pull request Oct 12, 2026
@szibis
szibis force-pushed the fix/aggregation-over-binary branch from 0257129 to 6df85f0 Compare October 12, 2026 11:45
@github-actions github-actions Bot added size/XL Extra large change scope/translator LogQL translator and removed size/XL Extra large change labels Oct 12, 2026
…pression

label_replace(a, ...) / b is a binary expression, not a transform of a: the
instant routing stripped the call by its prefix and answered a alone. The
wrapper is now removed only when its closing parenthesis ends the expression.
…reads escaped regexps

The transform ran on range matrices only, so an instant vector came back
without the new label. It now rewrites the labels of a vector and of a matrix
alike, keeps the rest of the answer, expands the replacement as Loki does and
files the points of series that end with one label set under one series on a
range query, as JoinSampleVector does.

The string arguments are unquoted like the LogQL lexer does, a call without
the four string arguments is a 400 parse error, topk/sort/stddev over a
label_replace no longer send the translator's marker to VictoriaLogs, a
label_replace around a binary expression on query_range routes by the
expression under it, and the without marker no longer swallows the markers
that follow it.
… the expression under it, and reports Loki's argument errors

The series of a label_replace answer are ordered by label set after the
transform (a range result, and an instant vector unless the query sorts by
value). The request is cloned once, above the routing chain, when a label
transform wraps the expression. A malformed call reports the token names and
the string start column of Loki's parser. label_join is no longer claimed as
a feature of the transform. Ranking over duplicate label sets that a
label_replace produced is registered as an open row.
szibis added a commit that referenced this pull request Oct 12, 2026
@szibis
szibis force-pushed the fix/aggregation-over-binary branch from 6df85f0 to be827a4 Compare October 12, 2026 11:57
@github-actions github-actions Bot added size/XL Extra large change and removed size/XL Extra large change labels Oct 12, 2026
…ary, like Loki

A sum, avg, min, max or count over a binary expression answered only the
first operand: the translator's outer-aggregation extraction dropped the
operator and the second operand, so `sum by (job) (A / B)`, `sum(A / 2)`, a
comparison and on()/ignoring() under an aggregation returned wrong values
with a 200, and an instant query with a literal or a nested binary first
answered 400 for a log query.

Loki joins the operands per series and folds the joined series per step
(newBinOpStepEvaluator, vectorBinop, VectorAggEvaluator.Next). The query and
query_range routing now send such an aggregation to the binary evaluator:
each operand stays a native VictoriaLogs stats query, the proxy joins the
aggregated series and folds them with the aggregation's operator. The
expression is read from the request so an operand keeps its own parser, a
one-sided offset is accepted as for a bare binary, and folded series come in
Loki's label order.

Registers semantics/aggregation-over-binary-dropped (fixed) and moves the
discovered cluster f2066991 to it.
…ary evaluator

Only an aggregation routed from under a label_replace reads the expression
inside it; a binary whose first operand is a label_replace is read whole
again, as before. The differential also draws one-to-one ignoring() over a
label one side lacks, and new tests pin a uniform offset on both sides.
… the folded answer

label_replace and label_join around `sum by (job) (a / b)` (the discovered
shape of cluster f2066991 on /query) route by the expression inside them on
query_range as on query, and the transform applies to the folded answer;
the transforms now apply to an instant vector as well as a matrix. A
transform is stripped only when its call is the whole expression:
`label_replace(a, ...) / b` is a binary whose operand applies its own.

The series a fold makes keep every label set apart (escaped keys: a value
holding `,` or `=` no longer folds with another set) and come in Loki's
order, labels.Compare: name then value, label by label.

The differential also starts half its range scenarios off the step grid.
Registers semantics/binary-division-by-zero-nan (open): `x / 0` answers
±Inf where Loki answers NaN.
… differential pins start+k*step

Under a label_replace or label_join the request is cloned to the expression
inside it from the request's own query, not from the handler's rewritten
one, which may have lost the parser stage an operand needs (a query naming
both `| json` and `| logfmt`). The aggregation differential's reference
evaluates at start+k*step, as a default Loki does; a join of two vectors off
the step grid answers on the aligned grid instead and is registered apart as
semantics/binary-step-grid (open). A transform's warnings and statistics are
pinned.
@github-actions github-actions Bot added size/XL Extra large change and removed size/XL Extra large change labels Oct 12, 2026

This branch has not been deployed

No deployments
Sign up for free to join this conversation on GitHub. Already have an account? Sign in to comment

Labels

bugfix Bug fix scope/docs Documentation scope/proxy Proxy core scope/tests Tests scope/translator LogQL translator size/XL Extra large change

Projects

None yet

Development

Successfully merging this pull request may close these issues.

2 participants