Skip to content

fix: a division or modulo by zero is NaN, like Loki - #745

Draft
szibis wants to merge 3 commits into
mainfrom
fix/binary-division-by-zero-nan
Draft

szibis wants to merge 3 commits into
mainfrom
fix/binary-division-by-zero-nan

Conversation

@szibis

@szibis szibis commented Oct 12, 2026

Copy link
Copy Markdown
Collaborator

Summary

New gap: semantics/binary-division-by-zero-nan.

Loki's rule. In Loki 3.7.7, syntax.MergeBinOp (pkg/logql/syntax/ast.go:1978-2005) returns NaN for a zero right operand of / and %, whatever the numerator. This applies:

  • in literal folding: reduceBinOp at ast.go:1918, so 1 / 0 is NaN;
  • in LiteralStepEvaluator: evaluator.go:1179;
  • in vectorBinop: evaluator.go:1020.

What the proxy did.

  • binarySampleValue computed a / b, so x / 0, -1 / 0 and Inf / 0 gave ±Inf. Only 0 / 0 gave NaN.
  • The fallback applyOp returned 0 for both / and %.

Fix. Both now return NaN for / and % when the divisor is 0 or -0. Comparisons (with and without bool), ^, and NaN/Inf operands already matched MergeBinOp; the edge table now pins them.

Tests

  • TestBinarySampleValueMatchesLokiMergeBinOp: 12 operators × 9 operands squared (0, -0, ±1, 2.5, -7, NaN, ±Inf), with and without bool, against a direct port of MergeBinOp.
  • TestBinaryMatchersMatchLokiMergeBinOp: the same table through the scalar-right, scalar-left and vector-vector matchers.
  • TestBinaryScalarFoldMatchesLokiReduceBinOp.
  • TestApplyOpDivisionAndModuloByZeroAreNaN.
  • TestBinaryVectorDivisionByZeroHandlers: query_range and query.
  • TestBinaryConstantVectorDivisionByZeroInstant.
  • Tests that pinned the old answers now expect NaN. One of them asserted 0, which a NaN satisfied vacuously.
  • e2e vs Loki: TestCompat_BinaryDivisionByZeroIsNaN, 12 shapes on query and query_range.

Pending before ready

Loki's MergeBinOp returns NaN for a zero right operand of / and % whatever the
numerator is, for literal folds, vector against literal and vector against
vector. The proxy computed IEEE a/b, so 1 / 0 and sum(rate(...)) / 0 were +Inf
or -Inf, and the fallback arithmetic answered 0.
@github-actions github-actions Bot added size/XL Extra large change scope/proxy Proxy core scope/docs Documentation scope/tests Tests bugfix Bug fix labels Oct 12, 2026
@github-actions github-actions Bot added size/XL Extra large change and removed size/XL Extra large change labels Oct 12, 2026
@github-actions

github-actions Bot commented Oct 12, 2026 •

Copy link
Copy Markdown
Contributor

⚪ Performance A/B: no change beyond noise

8 shape×range — 8 ⚪ same · results vs Loki: 7 same, 0 new difference(s), 1 pre-existing

Every shape is within noise of the base build (±30% and 100 ms).

8 unchanged shape×range (within noise)
shape range base p50 PR p50 change Loki p50 PR ÷ Loki result vs Loki
⚪ drilldown service landing 1h 31 ms 38 ms ⚪ +23% 24 ms 1.58× ✅ same
⚪ instant ungrouped rate instant 5 ms 8 ms ⚪ +60% 71 ms 0.11× ✅ same
⚪ json rate by level (no filter, no drop) 1h 400 400 ⚪ +0% 400 — ✅ same
⚪ json volume no filters 1h 218 ms 214 ms ⚪ -2% 43 ms 4.98× ✅ same
⚪ logs plain 1h 67 ms 76 ms ⚪ +13% 608 ms 0.12× ✅ same
⚪ logs | json 1h 106 ms 103 ms ⚪ -3% 62 ms 1.66× ✅ same
⚪ stream-label count by app 1h 28 ms 25 ms ⚪ -11% 38 ms 0.66× ✅ same
⚪ topk rate by app 1h 46 ms 45 ms ⚪ -2% 86 ms 0.52× ➖ differs (as base)
Cold (first-run) timings — what a user opening a panel sees
shape range base cold PR cold Loki cold PR ÷ Loki cold
drilldown service landing 1h 35 ms 34 ms 652 ms 0.05×
instant ungrouped rate instant 5 ms 5 ms 74 ms 0.07×
json rate by level (no filter, no drop) 1h 400 400 400 —
json volume no filters 1h 207 ms 209 ms 745 ms 0.28×
logs plain 1h 205 ms 110 ms 1.49 s 0.07×
logs | json 1h 172 ms 141 ms 1.69 s 0.08×
stream-label count by app 1h 24 ms 28 ms 563 ms 0.05×
topk rate by app 1h 48 ms 44 ms 644 ms 0.07×
Why these shapes
  • control smoke → 8: control/drilldown service landing, control/instant ungrouped rate, control/json rate by level (no filter, no drop), control/json volume no filters, control/logs plain, control/logs | json, control/stream-label count by app, control/topk rate by app

base b20a550f6f → PR 93a21159a3 · 4 runs (first is cold), warm p50 · ranges 1h · noise ±30% and 100 ms · VictoriaLogs restarts 0→0 · 2.4 min. Same runner, one fresh stack, targets interleaved per request. How to read and reproduce: bench/ab/README.md.

@github-actions

github-actions Bot commented Oct 12, 2026 •

Copy link
Copy Markdown
Contributor

✅ Visual smoke: passed with warnings

Base b20a550f6f vs PR e2bcf6ec60, Grafana through the proxy builds and Loki on one fresh stack; run.
Core set: 5 capture(s) at 1h. Detailed set: 0 entries (nothing visual touched). 5 capture(s), 15m/1h/6h, 24h and 7d stay out of PR runs.

page range set base = PR (data) vs Loki (PR) pixel diff result
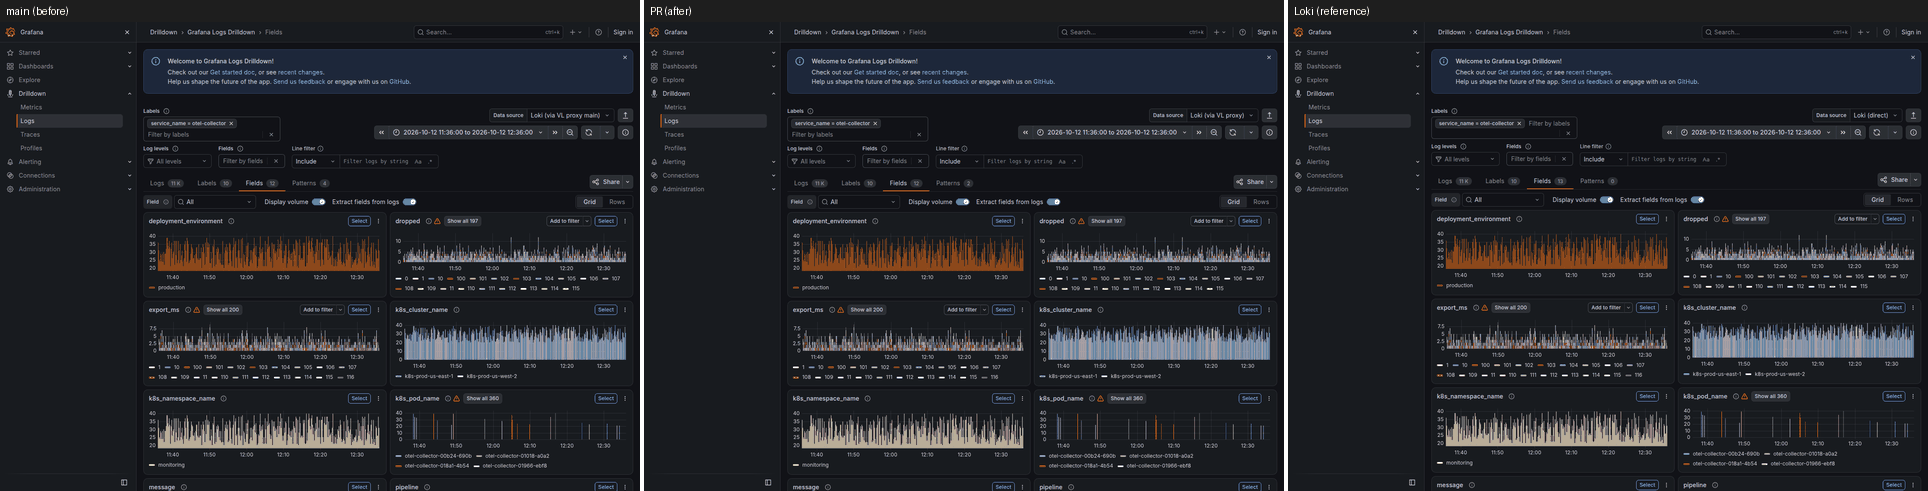
dd-fields 1h core ✅ identical identical (4 explained, 1 history-dependent) 0.12% ⚠️ history-dependent difference, not gated (1): resource /api/datasources/uid/*/res
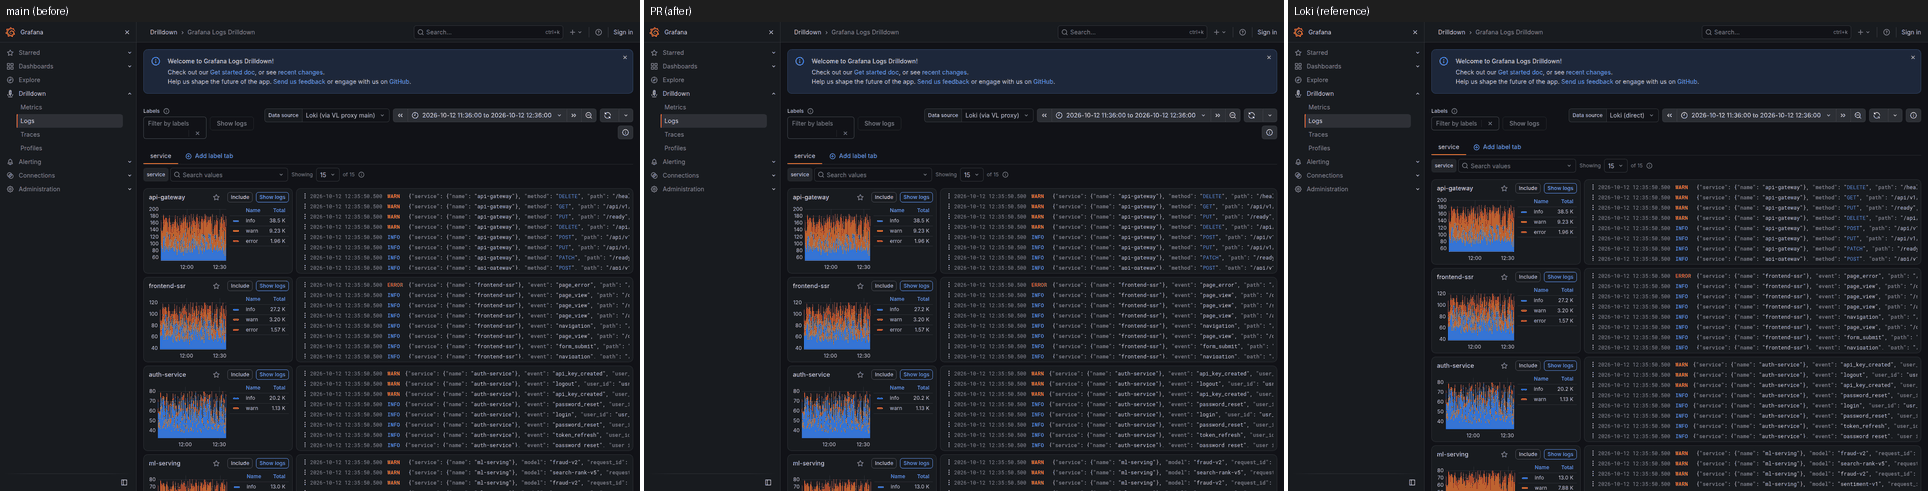
dd-landing 1h core ✅ identical identical (3 explained) 0.13% ✅
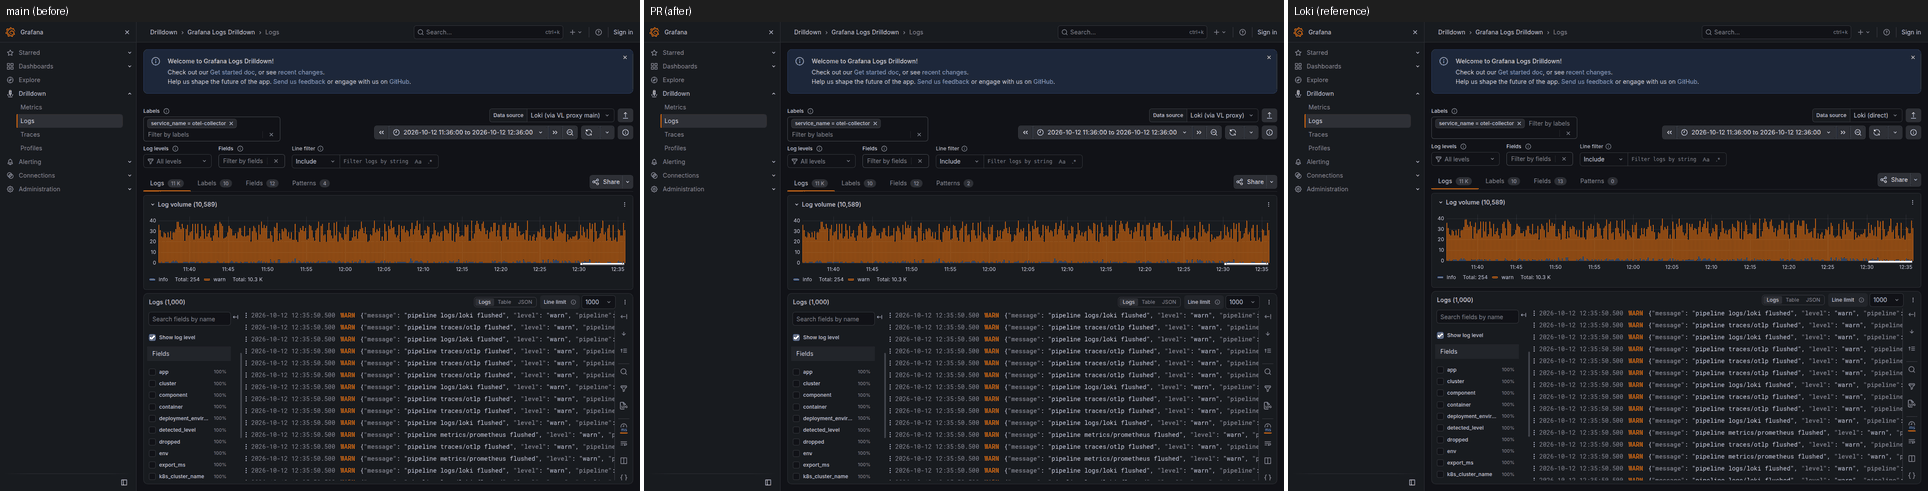
dd-service-logs 1h core ✅ identical identical (3 explained, 1 history-dependent) 0.12% ⚠️ history-dependent difference, not gated (1): resource /api/datasources/uid/*/res
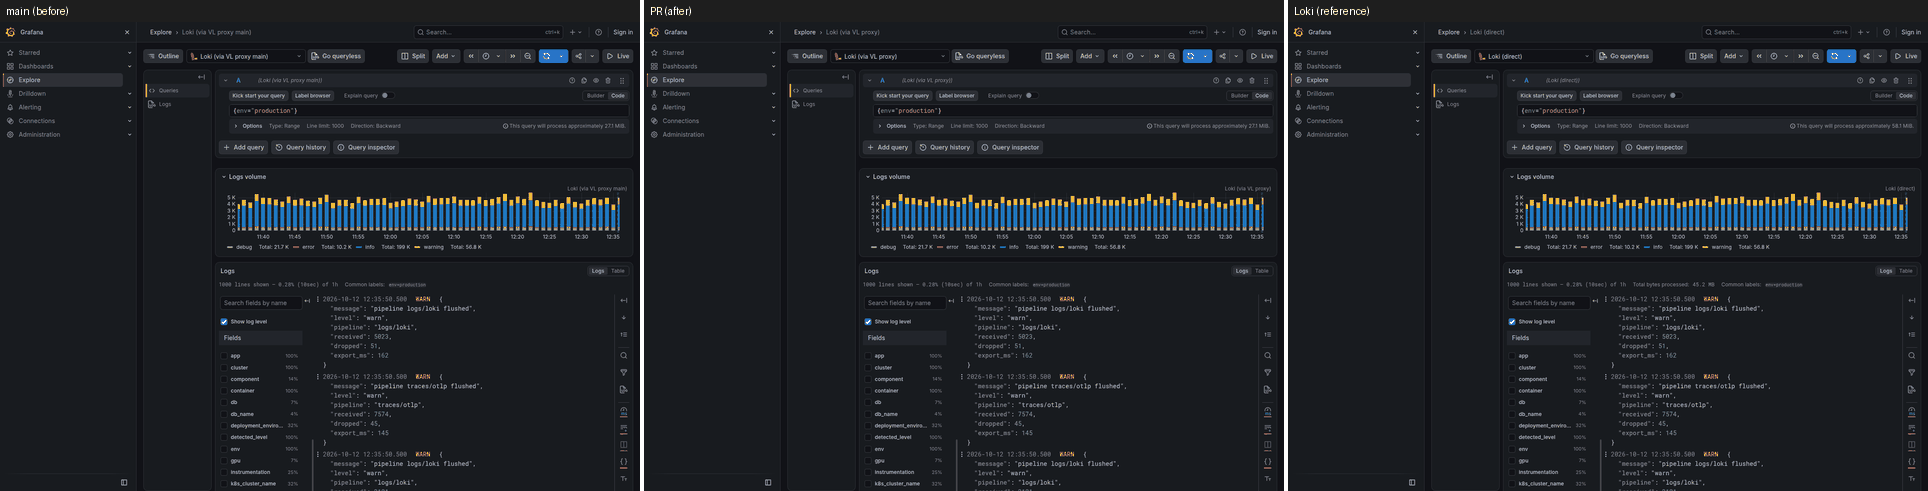
explore-logs-plain 1h core ✅ identical identical (1 explained) 0.07% ✅
explore-metric-plain 1h core ✅ identical identical (1 explained) 0.04% ✅

Gate: a base-vs-PR data difference passes when the PR is closer to Loki, and fails when the PR diverges from Loki or Loki cannot decide it (at a range Loki does not hold, a difference passes when the same page proved it closer to Loki at a shorter range; otherwise label the pull request visual-change-expected to accept an intended change). Also failing: a panel empty on the PR but not on the base, an error banner, panel error, error answer or new "No data" panel on the PR, a PR side that never settled, a difference that did not reproduce on the recapture. Pixel differences only warn.

dd-fields-1h: history-dependent difference, not gated (1): resource /api/datasources/uid/*/resources/patterns?end=2026-10-12T12%3A36%3
  • history-dependent difference, not gated (1): resource /api/datasources/uid/*/resources/patterns?end=2026-10-12T12%3A36%3A00.000Z&query=%7Bservic: body: content differs (rows 4 vs 2)
  • vs Loki, explained: query ('sum by (service_name_extracted) (count_over_time({service_name="otel-collector"} | servi: request only on one side (right) -- explained: Loki's _extracted suffix for a key named like a stream label, where the build does not return it (detected_fields: open, semantics/detected-fields-extracted-suffix; service/service.name: owner decision)
  • vs Loki, explained: resource /api/datasources/uid/*/resources/detected_fields?end=2026-10-12T12%3A36%3A00.000Z&query=%7: body: content differs (rows 13 vs 15) -- explained: Loki's _extracted suffix for a key named like a stream label, where the build does not return it (detected_fields: open, semantics/detected-fields-extracted-suffix; service/service.name: owner decision); the proxy also returns data, status; Loki lists fields in no fixed order
  • vs Loki, explained: resource /api/datasources/uid/*/resources/detected_labels?end=2026-10-12T12%3A36%3A00.000Z&query=%7: body: content differs (rows 9 vs 9) -- explained: sampled cardinality: Loki counts every stream its ingesters hold, not the requested window (pkg/ingester/instance.go LabelsWithValues), the proxy the window's last 5 minutes (metadataMaxFieldNamesWindow); the label names match; the proxy also returns data, limit, status; Loki lists labels in no fixed order
  • vs Loki, explained: resource /api/datasources/uid/*/resources/drilldown-limits: body: content differs (rows 0 vs 0) -- explained: configuration probe: each backend publishes its own limits, version and settings (the proxy's pattern persistence)

dd-fields-1h

dd-service-logs-1h: history-dependent difference, not gated (1): resource /api/datasources/uid/*/resources/patterns?end=2026-10-12T12%3A36%3
  • history-dependent difference, not gated (1): resource /api/datasources/uid/*/resources/patterns?end=2026-10-12T12%3A36%3A00.000Z&query=%7Bservic: body: content differs (rows 4 vs 2)
  • vs Loki, explained: resource /api/datasources/uid/*/resources/detected_fields?end=2026-10-12T12%3A36%3A00.000Z&query=%7: body: content differs (rows 13 vs 15) -- explained: Loki's _extracted suffix for a key named like a stream label, where the build does not return it (detected_fields: open, semantics/detected-fields-extracted-suffix; service/service.name: owner decision); the proxy also returns data, status; Loki lists fields in no fixed order
  • vs Loki, explained: resource /api/datasources/uid/*/resources/detected_labels?end=2026-10-12T12%3A36%3A00.000Z&query=%7: body: content differs (rows 9 vs 9) -- explained: sampled cardinality: Loki counts every stream its ingesters hold, not the requested window (pkg/ingester/instance.go LabelsWithValues), the proxy the window's last 5 minutes (metadataMaxFieldNamesWindow); the label names match; the proxy also returns data, limit, status; Loki lists labels in no fixed order
  • vs Loki, explained: resource /api/datasources/uid/*/resources/drilldown-limits: body: content differs (rows 0 vs 0) -- explained: configuration probe: each backend publishes its own limits, version and settings (the proxy's pattern persistence)

dd-service-logs-1h

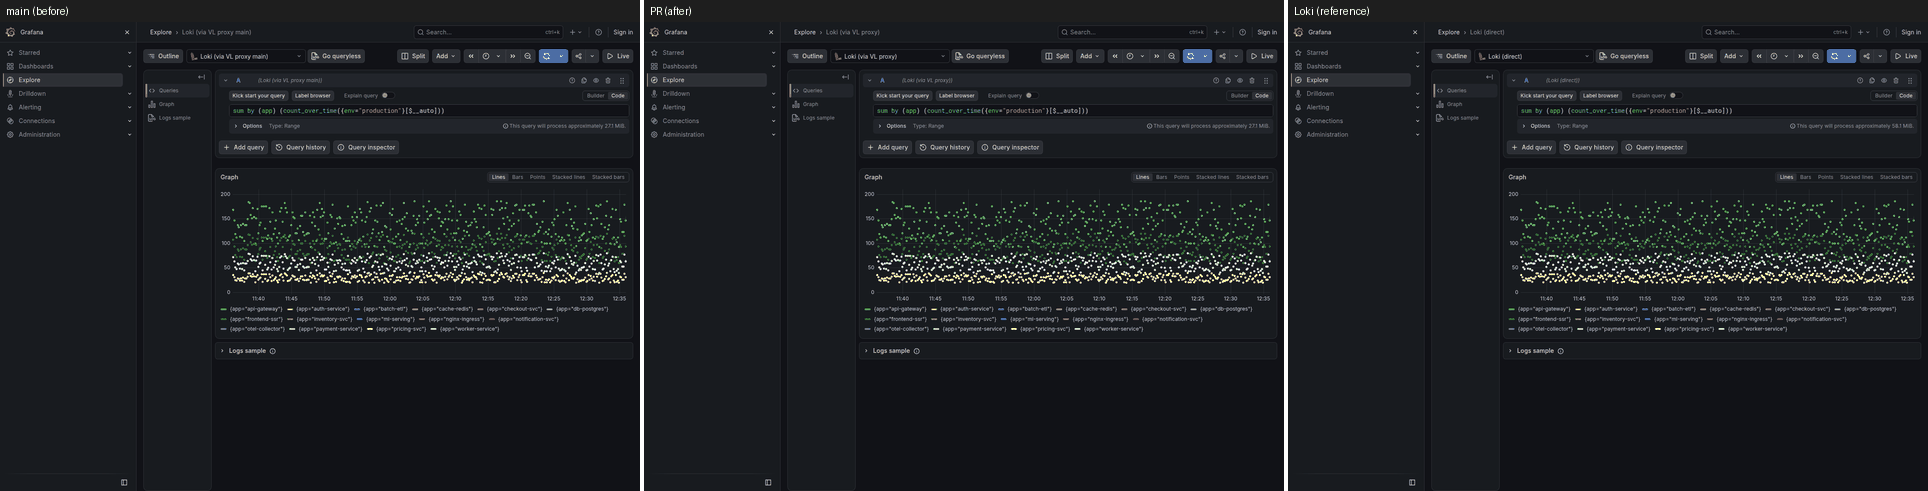
Core set montages (3): base | PR | Loki

dd-landing-1h

dd-landing-1h

explore-logs-plain-1h

explore-logs-plain-1h

explore-metric-plain-1h

explore-metric-plain-1h

All montages of this run: pr-visuals/pr-745.

@github-actions

github-actions Bot commented Oct 12, 2026 •

Copy link
Copy Markdown
Contributor

PR Quality Report

Compared against base branch main.

Coverage and tests

Signal Base PR Delta
Test count 8648 8671 23
Coverage 87.8% 87.7% -0.1% (stable)

Compatibility

Track Base PR Delta
Loki API 100.0% 11/11 (100.0%) 0.0% (stable)
Logs Drilldown 100.0% 17/17 (100.0%) 0.0% (stable)
VictoriaLogs 100.0% 11/11 (100.0%) 0.0% (stable)

Performance smoke

Lower CPU cost (ns/op) is better. Lower benchmark memory cost (B/op, allocs/op) is better. Higher throughput is better. Lower load-test memory growth is better. Benchmark rows are medians from repeated samples.

Signal Base PR Delta
QueryRange cache-hit CPU cost 3265.0 ns/op 3261.0 ns/op -0.1% (stable)
QueryRange cache-hit memory 1240.0 B/op 1240.0 B/op 0.0% (stable)
QueryRange cache-hit allocations 27.0 allocs/op 27.0 allocs/op 0.0% (stable)
QueryRange cache-bypass CPU cost 3755.0 ns/op 3779.0 ns/op +0.6% (stable)
QueryRange cache-bypass memory 1299.0 B/op 1296.0 B/op -0.2% (stable)
QueryRange cache-bypass allocations 27.0 allocs/op 27.0 allocs/op 0.0% (stable)
Labels cache-hit CPU cost 895.7 ns/op 880.4 ns/op -1.7% (stable)
Labels cache-hit memory 48.0 B/op 48.0 B/op 0.0% (stable)
Labels cache-hit allocations 3.0 allocs/op 3.0 allocs/op 0.0% (stable)
Labels cache-bypass CPU cost 1484.0 ns/op 1480.0 ns/op -0.3% (stable)
Labels cache-bypass memory 399.0 B/op 399.0 B/op 0.0% (stable)
Labels cache-bypass allocations 14.0 allocs/op 14.0 allocs/op 0.0% (stable)

State

  • Coverage, compatibility, and sampled performance are reported here from the same PR workflow.
  • This is a delta report, not a release gate by itself. Required checks still decide merge safety.
  • Performance is a smoke comparison, not a full benchmark lab run.
  • Delta states use the same noise guards as the quality gate (percent + absolute + low-baseline checks), so report labels match merge-gate behavior.

@github-actions

Copy link
Copy Markdown
Contributor

PR Quality Report

Compared against base branch main.

Coverage and tests

Signal Base PR Delta
Test count 8648 8671 23
Coverage 87.7% 87.8% +0.1% (stable)

Compatibility

Track Base PR Delta
Loki API 100.0% 11/11 (100.0%) 0.0% (stable)
Logs Drilldown 100.0% 17/17 (100.0%) 0.0% (stable)
VictoriaLogs 100.0% 11/11 (100.0%) 0.0% (stable)

Performance smoke

Lower CPU cost (ns/op) is better. Lower benchmark memory cost (B/op, allocs/op) is better. Higher throughput is better. Lower load-test memory growth is better. Benchmark rows are medians from repeated samples.

Signal Base PR Delta
QueryRange cache-hit CPU cost 3279.0 ns/op 3288.0 ns/op +0.3% (stable)
QueryRange cache-hit memory 1240.0 B/op 1240.0 B/op 0.0% (stable)
QueryRange cache-hit allocations 27.0 allocs/op 27.0 allocs/op 0.0% (stable)
QueryRange cache-bypass CPU cost 3895.0 ns/op 4037.0 ns/op +3.6% (stable)
QueryRange cache-bypass memory 1300.0 B/op 1297.0 B/op -0.2% (stable)
QueryRange cache-bypass allocations 27.0 allocs/op 27.0 allocs/op 0.0% (stable)
Labels cache-hit CPU cost 879.2 ns/op 878.9 ns/op -0.0% (stable)
Labels cache-hit memory 48.0 B/op 48.0 B/op 0.0% (stable)
Labels cache-hit allocations 3.0 allocs/op 3.0 allocs/op 0.0% (stable)
Labels cache-bypass CPU cost 1432.0 ns/op 1409.0 ns/op -1.6% (stable)
Labels cache-bypass memory 399.0 B/op 399.0 B/op 0.0% (stable)
Labels cache-bypass allocations 14.0 allocs/op 14.0 allocs/op 0.0% (stable)

State

  • Coverage, compatibility, and sampled performance are reported here from the same PR workflow.
  • This is a delta report, not a release gate by itself. Required checks still decide merge safety.
  • Performance is a smoke comparison, not a full benchmark lab run.
  • Delta states use the same noise guards as the quality gate (percent + absolute + low-baseline checks), so report labels match merge-gate behavior.

…he compose Loki times out on literal-only queries

This branch has not been deployed

No deployments
Sign up for free to join this conversation on GitHub. Already have an account? Sign in to comment

Labels

bugfix Bug fix scope/docs Documentation scope/proxy Proxy core scope/tests Tests size/XL Extra large change

Projects

None yet

Development

Successfully merging this pull request may close these issues.

1 participant