Skip to content

fix: label_replace adds its label to instant answers and to post-aggregated series, like Loki - #744

Draft
szibis wants to merge 10 commits into
mainfrom
fix/label-replace-new-label
Draft

szibis wants to merge 10 commits into
mainfrom
fix/label-replace-new-label

Conversation

@szibis

@szibis szibis commented Oct 12, 2026 •

Copy link
Copy Markdown
Collaborator

Summary

Gap semantics/label-replace-new-label (cluster a9d4f85c, instant queries). On Loki 3.7.7, label_replace works per step on both a vector and a matrix (pkg/logql/evaluator.go:1275-1309). The proxy's applyLabelReplace/applyLabelJoin decoded only a matrix, so an instant vector came back without the new label.

Fixed, matching Loki:

  • Transform on both shapes. transformSeriesLabels rewrites labels on a vector or a matrix and keeps the rest of the answer, e.g. data.stats.
  • Loki's label_replace rules. The regexp is anchored and the replacement is expanded with ExpandString. A series with no match is unchanged, and an empty expansion removes the destination label.
  • Duplicate label sets. These follow Loki's JoinSampleVector/vectorsToSeries (engine.go:440-470, 530-600): an instant query keeps both samples, and a range query files the points under one series.
  • Argument strings. These are unquoted like Loki's lexer (syntax/lex.go:191-198). "\\." is now the regexp \., and escaped quotes work.
  • No internal markers sent to VictoriaLogs. topk/bottomk/sort/stddev over a label_replace sent an internal marker to VictoriaLogs and got a 400. The transform now runs on the inner expression before the ranking, as Loki evaluates it.
  • query_range routing. label_replace around a binary expression now routes by the inner expression, as fix: an instant query keeps its failure status and always answers a resultType #735 does for instant.
  • Without-marker parsing. label_replace(sum without (level)(...)) no longer loses its transform.
  • Malformed calls. Wrong arity, an unquoted argument or an invalid escape is now a 400 parse error instead of a log query.

VictoriaLogs still does all aggregation. The proxy only rewrites labels on the aggregated series.

Tests

  • TestLabelReplaceEdgeTable: 29 rules × matrix and vector.
  • Duplicate label sets; label_join; instant and range; the registry row's query for curl, Explore and Drilldown clients; bare range aggregation; post-aggregations; sum without; malformed arguments; invalid regexp.
  • TestLabelReplaceDifferential: random nested transforms on both endpoints. Its reference is independent for the plumbing (translator markers, both endpoints, nested chains) and for Loki's duplicate merge; the per-series rule reuses Loki's ExpandString sequence.
  • Translator tests for unquoting and marker parsing.
  • e2e vs Loki: TestCompat_LabelReplaceNewLabel, about 38 shapes × query_range and query.

Local proofs (e2e vs Loki 3.7.7 on VictoriaLogs v1.52.0 and v1.47.0, A/B base e9b5ef1 vs branch)

Changes since the first push

The first e2e run in CI found two product bugs and two test problems; all are fixed here.

  • An instant label_replace(count_over_time({env="production"}[5m]), ...) (any bare range function) was one unlabeled {} total instead of one series per stream. The grouping by stream was added only for a query that itself starts with the function; it now follows the expression under the transform (preserveMetricStreamIdentity, and the same check in the two handlers).
  • A label_replace around a metric over | json skipped the evaluator that owns JSON parser errors: a line that is not JSON no longer failed the query, and | json | __error__="" kept every stream (14 apps) instead of the ones that parse (8, as Loki). It is now answered by that evaluator and the transform is applied to its answer.
  • Test: Loki's bare range-function series carry the entry's structured metadata and the proxy's keep the stream (metric-identity/structured-metadata-splits-series, owner-kept), so the two bare shapes leave those label names out of both sides; app_short, buzz, the stream labels and detected_level are still compared.
  • Test: topk(2, ...) over tied values (several apps at 6) lets Loki pick different ties per step; the shape is now topk(1, ...), where api-gateway is the unique maximum.

Unit tests: TestLabelReplaceOverBareRangeFunctionKeepsOneSeriesPerStream and TestLabelReplaceOverJSONMetricUsesTheOrderedJSONEvaluator; both fail without the fixes. go test -short of internal/translator, internal/proxy, internal/logql, go vet (also -tags e2e) and golangci-lint v2.14.0 are clean.

e2e vs Loki 3.7.7, fresh isolated stack per VictoriaLogs version

VictoriaLogs RestartCount 0 before and after each run (no OOM).

test v1.52.0 v1.47.0
TestCompat_LabelReplaceNewLabel pass, 70 subtests pass, 70
TestCompat_LabelReplaceDuplicatesBeforeRanking pass pass
TestMissingOps_LabelReplace pass, 1 pass + 1 skip (label_replace_sum, skipped by the test itself: the aggregation-over-label_replace gap, now registered) same
TestCompat_InstantResultTypeAlwaysSet pass, 32 pass, 32
TestLogQL_Exhaustive_ErrorParity / _QueryParity / _KnownGaps pass, 73 / 284 / 3 same
TestHardeningLive_ParserError* (4 tests, JSON parser-error parity, regression set for fix 2) pass, 64 / 8 / 16 / 64 same

Notes:

  • TestCompat_LabelReplaceDuplicatesBeforeRanking passes on this data although semantics/label-replace-duplicates-before-ranking is open: the shape it ranks does not reproduce a point-count difference here. The row stays open.
  • The two shapes that compare the points per step (two series with one label set, all labels removed, query_range) pass on a fresh stack and fail (153 points on Loki, 140 on the proxy) on every re-run against the same stack: a re-run ingests the fixture again, and VictoriaLogs counts the duplicates where Loki deduplicates them. They are not loosened; run the group once per fresh stack, as CI does.

A/B (base = e9b5ef1, branch = 4e21fc8, which holds the fixes; 1h with Loki, 5 runs, warm p50, one stack, targets interleaved)

Affected shapes (set label-replace):

shape range Loki p50 base p50 branch p50 base vs Loki branch vs Loki
L1 label_replace over sum by rate instant 109 ms 5 ms 5 ms same same
L2 label_replace over sum by rate 1h 166 ms 29 ms 35 ms same same
L3 topk over label_replace over sum by count 1h 70 ms 22 ms 48 ms differs differs
L4 label_replace over bare count_over_time instant 13 ms 3 ms 7 ms differs (one {} total) same
L5 label_replace over | json | __error__="" sum by instant 14 ms 18 ms 50 ms same same
L6 label_replace over | json | __error__="" sum by 1h 15 ms 21 ms 554 ms same same
  • The A/B compares values and series, not label names; the labels are proven by the e2e above.
  • L3 differs from Loki on base and branch alike (topk ties; the e2e shape uses topk(1)).
  • L5 and L6 move from the cheap VictoriaLogs stats query to the evaluator that reads rows, which is what makes the answer match Loki on streams with invalid JSON. Their cost is the metric's own: the same query without the label_replace takes 531 ms on the base and 509 ms on the branch for a 1h range, and 40 ms and 41 ms instant. The A/B flags L6 as the one slower shape; I did not hide it. On this generator data every api-gateway line is valid JSON, so base and branch give the same series here; on a stream with invalid lines the base answered wrongly (14 apps against Loki's 8 in the e2e fixtures).

Control set (20 shapes), 1h with Loki: 20 of 20 same, VictoriaLogs restarts 0 to 0, new differences from Loki 0, pre-existing 1 (topk rate by app, also on base). Largest absolute increases: instant json filtered 150 to 163 ms, drilldown service landing 10 to 14 ms, logs | logfmt 42 to 45 ms.

Saved results: bench/ab/results/2026-10-12-labelreplace-1h.json and 2026-10-12-labelreplace-control-1h.json; shape set label-replace.

Registry

  • Fixed row semantics/label-replace-new-label (text and planned tests updated).
  • New open rows: semantics/label-replace-aggregation-over-transform (an aggregation over a label_replace is a 400 on the proxy and answers on Loki) and semantics/label-replace-around-ranking-and-vector (a label_replace around topk, sort or vector()). Both answer the same on the base, so neither is new. The PR body's draft about a binary operand (label_replace(...) * 2) no longer reproduces and is not registered.
  • label_join is accepted by the proxy but not part of Loki 3.7.7's grammar; it is handled by fix: reject group(), label_join() and other names Loki does not have, and accept keywords in any case, like Loki #748 and only noted in the row text here.
  • Visual: the row keeps visual: none (the visible difference is on instant queries, which the visual harness does not capture; the json difference needs a stream with invalid lines).

@github-actions github-actions Bot added size/XL Extra large change scope/translator LogQL translator scope/proxy Proxy core scope/docs Documentation scope/tests Tests bugfix Bug fix and removed size/XL Extra large change labels Oct 12, 2026
@github-actions

github-actions Bot commented Oct 12, 2026 •

Copy link
Copy Markdown
Contributor

🔴 Performance A/B: regression

104 shape×range — 2 🔴 slower · 102 ⚪ same · results vs Loki: 86 same, 0 new difference(s), 18 pre-existing

shape range base p50 PR p50 change Loki p50 PR ÷ Loki result vs Loki
🔴 L3 topk over label_replace over sum by count 1h 113 ms 234 ms ¹ 🔴 +107% 89 ms 2.63× ➖ differs (as base)
🔴 L6 label_replace over json sum by 1h 100 ms 1.30 s ¹ 🔴 +1200% 31 ms 42× ✅ same

¹ re-measured with 7 runs, on windows the first pass did not use, after it moved beyond noise.

102 unchanged shape×range (within noise)
shape range base p50 PR p50 change Loki p50 PR ÷ Loki result vs Loki
⚪ bytes_over_time by app 1h 70 ms 71 ms ⚪ +1% 89 ms 0.80× ✅ same
⚪ drilldown service landing 1h 31 ms 32 ms ⚪ +3% 24 ms 1.33× ✅ same
⚪ instant json filtered instant 415 ms 418 ms ⚪ +1% 72 ms 5.81× ✅ same
⚪ instant json volume instant 467 ms 466 ms ⚪ -0% 97 ms 4.80× ✅ same
⚪ instant ungrouped rate instant 6 ms 11 ms ⚪ +83% 73 ms 0.15× ✅ same
⚪ json rate by level (no filter, no drop) 1h 400 400 ⚪ +0% 400 — ✅ same
⚪ json volume no filters 1h 205 ms 195 ms ⚪ -5% 2 ms 98× ✅ same
⚪ logfmt count by level, filter, drop 1h 459 ms 446 ms ⚪ -3% 53 ms 8.42× ✅ same
⚪ logfmt volume 1h 302 ms 299 ms ⚪ -1% 58 ms 5.16× ✅ same
⚪ logs plain 1h 65 ms 66 ms ⚪ +2% 35 ms 1.89× ✅ same
⚪ logs | json 1h 95 ms 96 ms ⚪ +1% 54 ms 1.78× ✅ same
⚪ logs | logfmt 1h 148 ms 157 ms ⚪ +6% 45 ms 3.49× ✅ same
⚪ stream-label count by app 1h 28 ms 25 ms ⚪ -11% 37 ms 0.68× ✅ same
⚪ topk rate by app 1h 45 ms 43 ms ⚪ -4% 88 ms 0.49× ➖ differs (as base)
⚪ ungrouped rate 1h 11 ms 11 ms ⚪ +0% 79 ms 0.14× ✅ same
⚪ DB1 label breakdown pod 1h 76 ms 76 ms ⚪ +0% 104 ms 0.73× ✅ same
⚪ DB2 label breakdown namespace 1h 19 ms 16 ms ⚪ -16% 30 ms 0.53× ✅ same
⚪ DB3 json field breakdown user_id 1h 51 ms 48 ms ⚪ -6% 23 ms 2.09× ✅ same
⚪ DB4 json field breakdown batch_id 1h 96 ms 100 ms ⚪ +4% 54 ms 1.85× ✅ same
⚪ X1 json filter level_extracted, by level 1h 395 ms 402 ms ⚪ +2% 39 ms 10× ✅ same
⚪ X2 json group by level_extracted 1h 315 ms 312 ms ⚪ -1% 43 ms 7.26× ✅ same
⚪ X3 json rate, level_extracted equality 1h 286 ms 286 ms ⚪ +0% 35 ms 8.17× ✅ same
⚪ X4 json bytes, level_extracted regexp 1h 411 ms 417 ms ⚪ +1% 91 ms 4.58× ✅ same
⚪ X5 logfmt filter level_extracted, by level 1h 682 ms 686 ms ⚪ +1% 49 ms 14× ✅ same
⚪ E1 logs, json parser over stream labels 1h 113 ms 115 ms ⚪ +2% 62 ms 1.85× ✅ same
⚪ E2 logs, logfmt parser over stream labels 1h 75 ms 72 ms ⚪ -4% 53 ms 1.36× ✅ same
⚪ E3 logs, json, existence filter on level_extracted 1h 139 ms 141 ms ⚪ +1% 80 ms 1.76× ✅ same
⚪ E4 logs, logfmt, existence filter on level_extracted 1h 93 ms 92 ms ⚪ -1% 62 ms 1.48× ✅ same
⚪ E5 logs, json, drop level_extracted 1h 110 ms 119 ms ⚪ +8% 60 ms 1.98× ✅ same
⚪ E6 logfmt count by level_extracted 1h 54 ms 45 ms ⚪ -17% 7 ms 6.43× ✅ same
⚪ E7 json count by level_extracted 1h 144 ms 149 ms ⚪ +3% 16 ms 9.31× ✅ same
⚪ E8 instant logfmt by level_extracted instant 7 ms 6 ms ⚪ -14% 10 ms 0.60× ✅ same
⚪ A explore volume, 2 filters, drop 1h 157 ms 154 ms ⚪ -2% 106 ms 1.45× ✅ same
⚪ B grouped sum, filter, no drop 1h 107 ms 101 ms ⚪ -6% 33 ms 3.06× ✅ same
⚪ C ungrouped sum, filter, no drop 1h 102 ms 101 ms ⚪ -1% 34 ms 2.97× ✅ same
⚪ D volume, no filters 1h 215 ms 224 ms ⚪ +4% 43 ms 5.21× ✅ same
⚪ E field breakdown pipeline (explore) 1h 101 ms 104 ms ⚪ +3% 34 ms 3.06× ✅ same
⚪ F field breakdown service_version (explore) 1h 172 ms 158 ms ⚪ -8% 41 ms 3.85× ✅ same
⚪ G field breakdown pipeline (drilldown) 1h 43 ms 44 ms ⚪ +2% 22 ms 2.00× ✅ same
⚪ H field breakdown service_version (drilldown) 1h 96 ms 101 ms ⚪ +5% 24 ms 4.21× ✅ same
⚪ I grafana volume of B 1h 101 ms 104 ms ⚪ +3% 33 ms 3.15× ✅ same
⚪ L1 label_replace over sum by rate, instant instant 13 ms 11 ms ⚪ -15% 78 ms 0.14× ✅ same
⚪ L2 label_replace over sum by rate 1h 138 ms 137 ms ⚪ -1% 89 ms 1.54× ✅ same
⚪ L4 label_replace over bare count_over_time, instant instant 4 ms 13 ms ⚪ +225% 22 ms 0.59× ✅ same
⚪ L5 label_replace over json sum by, instant instant 37 ms 110 ms ⚪ +197% 24 ms 4.58× ✅ same
⚪ O2 explore log volume (Grafana form), underscore structured-metadata filter 1h 69 ms 70 ms ⚪ +1% 33 ms 2.12× ✅ same
⚪ DL1 drilldown field breakdown json-expr, level filter 1h 500 ms 497 ms ⚪ -1% 22 ms 23× ✅ same
⚪ DL2 drilldown field breakdown, level + stream-label filter before json 1h 54 ms 54 ms ⚪ +0% 6 ms 9.00× ✅ same
⚪ DL3 drilldown logfmt field breakdown, level filter 1h 598 ms 610 ms ⚪ +2% 93 ms 6.56× ➖ differs (as base)
⚪ DL4 instant count, level filter, json+logfmt, 1h instant 525 ms 510 ms ⚪ -3% 1.32 s 0.39× ✅ sum ±0.25%
⚪ DL6 explore volume, level filter before json 1h 525 ms 529 ms ⚪ +1% 36 ms 15× ✅ sum ±0.25%
⚪ OR1 logs, or alternatives 1h 78 ms 74 ms ⚪ -5% 57 ms 1.30× ✅ same
⚪ OR2 logs, negated or alternatives 1h 67 ms 71 ms ⚪ +6% 41 ms 1.73× ✅ same
⚪ OR3 logs, regexp or alternatives 1h 63 ms 58 ms ⚪ -8% 65 ms 0.89× ✅ same
⚪ OR4 count by level, or alternatives with parser 1h 79 ms 82 ms ⚪ +4% 28 ms 2.93× ✅ same
⚪ OR5 rate, negated regexp or alternatives 1h 55 ms 56 ms ⚪ +2% 82 ms 0.68× ✅ same
⚪ OR6 instant, or alternatives instant 7 ms 6 ms ⚪ -14% 59 ms 0.10× ✅ same
⚪ P1 api-gateway empty pattern 1h 23 ms 22 ms ⚪ -4% 6 ms 3.67× ✅ same
⚪ P2 api-gateway not empty pattern, line filter 1h 75 ms 77 ms ⚪ +3% 21 ms 3.67× ✅ same
⚪ P3 nginx count_over_time, pattern with spaces 1h 12 ms 12 ms ⚪ +0% 6 ms 2.00× ✅ same
⚪ P4 nginx count_over_time, GET request pattern 1h 13 ms 13 ms ⚪ +0% 6 ms 2.17× ✅ same
⚪ P1 logs, json, level equals 1h 137 ms 125 ms ⚪ -9% 80 ms 1.56× ✅ same
⚪ P2 logs, logfmt, level not equal 1h 30 ms 29 ms ⚪ -3% 4 ms 7.25× ✅ same
⚪ P3 logs, json, level existence 1h 136 ms 149 ms ⚪ +10% 70 ms 2.13× ✅ same
⚪ P4 logfmt count by level 1h 31 ms 31 ms ⚪ +0% 6 ms 5.17× ✅ same
⚪ P5 json count by level 1h 79 ms 84 ms ⚪ +6% 14 ms 6.00× ✅ same
⚪ P6 json count, level filter 1h 15 ms 15 ms ⚪ +0% 12 ms 1.25× ✅ same
⚪ P7 json rate by level, level regexp 1h 17 ms 16 ms ⚪ -6% 14 ms 1.14× ✅ same
⚪ P8 json count by a name that is no stream label 1h 86 ms 87 ms ⚪ +1% 12 ms 7.25× ✅ same
⚪ P9 instant logfmt by level instant 5 ms 5 ms ⚪ +0% 9 ms 0.56× ✅ same
⚪ E1 json duration_ms sum by service 1h 86 ms 85 ms ⚪ -1% 14 ms 6.07× ➖ differs (as base)
⚪ E2 json duration_ms p95 by service 1h 435 ms 424 ms ⚪ -3% 14 ms 30× ✅ same
⚪ E3 logfmt latency_ms rate, production 1h 509 ms 512 ms ⚪ +1% 126 ms 4.06× ➖ differs (as base)
⚪ E4 logfmt size_bytes max by service 1h 49 ms 47 ms ⚪ -4% 14 ms 3.36× ➖ differs (as base)
⚪ E5 json duration_ms sum, instant instant 35 ms 35 ms ⚪ +0% 26 ms 1.35× ✅ same
⚪ E6 logfmt ttl unit string (Loki 400) 1h 400 400 ⚪ +0% 400 — ✅ same
⚪ E7 json hexadecimal trace_id (Loki 400) 1h 400 400 ⚪ +3% 400 — ✅ same
⚪ E8 json duration_ms sum by service, namespace prod 1h 188 ms 194 ms ⚪ +3% 77 ms 2.52× ➖ differs (as base)
⚪ E9 logfmt latency_ms sum by service, namespace prod 1h 310 ms 309 ms ⚪ -0% 90 ms 3.43× ➖ differs (as base)
⚪ U1 logfmt amount rate 1h 37 ms 36 ms ⚪ -3% 12 ms 3.00× ✅ same
⚪ U2 json duration_ms rate 1h 87 ms 93 ms ⚪ +7% 22 ms 4.23× ✅ same
⚪ U3 json duration_ms rate, error filter 1h 88 ms 88 ms ⚪ +0% 27 ms 3.26× ✅ same
⚪ U4 logfmt latency_ms rate, production 1h 348 ms 351 ms ⚪ +1% 125 ms 2.81× ➖ differs (as base)
⚪ U5 logfmt amount rate, instant instant 7 ms 8 ms ⚪ +14% 11 ms 0.73× ✅ same
⚪ U6 json duration_ms rate, instant instant 12 ms 14 ms ⚪ +17% 20 ms 0.70× ✅ same
⚪ U7 json duration_ms sum_over_time, instant instant 15 ms 16 ms ⚪ +7% 20 ms 0.80× ✅ same
⚪ U8 logfmt amount rate by service (grouped) 1h 42 ms 41 ms ⚪ -2% 12 ms 3.42× ✅ same
⚪ U9 logfmt amount rate_counter (folded per series) 1h 287 ms 292 ms ⚪ +2% 33 ms 8.85× ➖ differs (as base)
⚪ U1 json duration_ms sum by service 1h 86 ms 84 ms ⚪ -2% 13 ms 6.46× ➖ differs (as base)
⚪ U10 instant sum_over_time unwrap instant 32 ms 36 ms ⚪ +12% 27 ms 1.33× ✅ same
⚪ U11 instant max_over_time missing label instant 5 ms 5 ms ⚪ +0% 14 ms 0.36× ✅ same
⚪ U12 json duration_ms over every service 1h 241 ms 239 ms ⚪ -1% 41 ms 5.83× ➖ differs (as base)
⚪ U13 logfmt latency_ms over every service 1h 511 ms 513 ms ⚪ +0% 56 ms 9.16× ➖ differs (as base)
⚪ U14 duration() of a unit string 1h 48 ms 46 ms ⚪ -4% 7 ms 6.57× ➖ differs (as base)
⚪ U2 json duration_ms max by service 1h 105 ms 95 ms ⚪ -10% 38 ms 2.50× ➖ differs (as base)
⚪ U3 json duration_ms sliding sum 1h 84 ms 86 ms ⚪ +2% 31 ms 2.77× ➖ differs (as base)
⚪ U4 logfmt size_bytes sum by service 1h 43 ms 39 ms ⚪ -9% 6 ms 6.50× ➖ differs (as base)
⚪ U5 logfmt ttl unit string (no sample) 1h 39 ms 39 ms ⚪ +0% 6 ms 6.50× ✅ same
⚪ U6 missing label, no parser 1h 19 ms 19 ms ⚪ +0% 8 ms 2.38× ✅ same
⚪ U7 missing label, ungrouped sum 1h 17 ms 17 ms ⚪ +0% 9 ms 1.89× ✅ same
⚪ U8 rate of an unwrapped label 1h 87 ms 87 ms ⚪ +0% 14 ms 6.21× ✅ same
⚪ U9 bytes() conversion 1h 51 ms 53 ms ⚪ +4% 11 ms 4.82× ➖ differs (as base)
Cold (first-run) timings — what a user opening a panel sees
shape range base cold PR cold Loki cold PR ÷ Loki cold
L3 topk over label_replace over sum by count 1h 130 ms 230 ms 90 ms 2.56×
L6 label_replace over json sum by 1h 102 ms 1.30 s 30 ms 43.43×
bytes_over_time by app 1h 68 ms 71 ms 709 ms 0.10×
drilldown service landing 1h 31 ms 34 ms 521 ms 0.07×
instant json filtered instant 433 ms 425 ms 73 ms 5.82×
instant json volume instant 480 ms 480 ms 99 ms 4.85×
instant ungrouped rate instant 6 ms 9 ms 74 ms 0.12×
json rate by level (no filter, no drop) 1h 400 400 400 —
json volume no filters 1h 226 ms 195 ms 3 ms 65.00×
logfmt count by level, filter, drop 1h 449 ms 454 ms 938 ms 0.48×
logfmt volume 1h 217 ms 234 ms 1.07 s 0.22×
logs plain 1h 88 ms 71 ms 38 ms 1.87×
logs | json 1h 95 ms 97 ms 56 ms 1.73×
logs | logfmt 1h 154 ms 164 ms 51 ms 3.22×
stream-label count by app 1h 24 ms 27 ms 718 ms 0.04×
topk rate by app 1h 43 ms 43 ms 674 ms 0.06×
ungrouped rate 1h 11 ms 10 ms 570 ms 0.02×
DB1 label breakdown pod 1h 106 ms 97 ms 773 ms 0.13×
DB2 label breakdown namespace 1h 16 ms 24 ms 539 ms 0.04×
DB3 json field breakdown user_id 1h 64 ms 56 ms 626 ms 0.09×
DB4 json field breakdown batch_id 1h 104 ms 93 ms 501 ms 0.19×
X1 json filter level_extracted, by level 1h 3.71 s 3.61 s 643 ms 5.61×
X2 json group by level_extracted 1h 317 ms 315 ms 806 ms 0.39×
X3 json rate, level_extracted equality 1h 284 ms 283 ms 510 ms 0.55×
X4 json bytes, level_extracted regexp 1h 440 ms 405 ms 592 ms 0.68×
X5 logfmt filter level_extracted, by level 1h 683 ms 685 ms 893 ms 0.77×
E1 logs, json parser over stream labels 1h 151 ms 107 ms 63 ms 1.70×
E2 logs, logfmt parser over stream labels 1h 86 ms 81 ms 54 ms 1.50×
E3 logs, json, existence filter on level_extracted 1h 181 ms 133 ms 68 ms 1.96×
E4 logs, logfmt, existence filter on level_extracted 1h 99 ms 109 ms 57 ms 1.91×
E5 logs, json, drop level_extracted 1h 121 ms 115 ms 76 ms 1.51×
E6 logfmt count by level_extracted 1h 46 ms 45 ms 37 ms 1.22×
E7 json count by level_extracted 1h 1.47 s 1.70 s 140 ms 12.11×
E8 instant logfmt by level_extracted instant 7 ms 6 ms 9 ms 0.67×
A explore volume, 2 filters, drop 1h 1.44 s 1.39 s 1.08 s 1.28×
B grouped sum, filter, no drop 1h 125 ms 124 ms 895 ms 0.14×
C ungrouped sum, filter, no drop 1h 126 ms 120 ms 466 ms 0.26×
D volume, no filters 1h 206 ms 212 ms 803 ms 0.26×
E field breakdown pipeline (explore) 1h 109 ms 107 ms 514 ms 0.21×
F field breakdown service_version (explore) 1h 1.37 s 1.39 s 565 ms 2.45×
G field breakdown pipeline (drilldown) 1h 48 ms 48 ms 469 ms 0.10×
H field breakdown service_version (drilldown) 1h 159 ms 138 ms 547 ms 0.25×
I grafana volume of B 1h 118 ms 110 ms 591 ms 0.19×
L1 label_replace over sum by rate, instant instant 32 ms 14 ms 91 ms 0.15×
L2 label_replace over sum by rate 1h 147 ms 134 ms 604 ms 0.22×
L4 label_replace over bare count_over_time, instant instant 4 ms 13 ms 23 ms 0.57×
L5 label_replace over json sum by, instant instant 49 ms 110 ms 27 ms 4.07×
O2 explore log volume (Grafana form), underscore structured-metadata filter 1h 167 ms 152 ms 603 ms 0.25×
DL1 drilldown field breakdown json-expr, level filter 1h 527 ms 507 ms 425 ms 1.19×
DL2 drilldown field breakdown, level + stream-label filter before json 1h 85 ms 89 ms 24 ms 3.71×
DL3 drilldown logfmt field breakdown, level filter 1h 640 ms 638 ms 861 ms 0.74×
DL4 instant count, level filter, json+logfmt, 1h instant 507 ms 520 ms 1.33 s 0.39×
DL6 explore volume, level filter before json 1h 1.05 s 1.03 s 690 ms 1.50×
OR1 logs, or alternatives 1h 98 ms 72 ms 79 ms 0.91×
OR2 logs, negated or alternatives 1h 88 ms 66 ms 39 ms 1.69×
OR3 logs, regexp or alternatives 1h 59 ms 60 ms 59 ms 1.02×
OR4 count by level, or alternatives with parser 1h 126 ms 134 ms 390 ms 0.34×
OR5 rate, negated regexp or alternatives 1h 55 ms 55 ms 677 ms 0.08×
OR6 instant, or alternatives instant 8 ms 7 ms 60 ms 0.12×
P1 api-gateway empty pattern 1h 46 ms 23 ms 63 ms 0.37×
P2 api-gateway not empty pattern, line filter 1h 87 ms 74 ms 19 ms 3.89×
P3 nginx count_over_time, pattern with spaces 1h 13 ms 12 ms 19 ms 0.63×
P4 nginx count_over_time, GET request pattern 1h 13 ms 13 ms 34 ms 0.38×
P1 logs, json, level equals 1h 184 ms 122 ms 80 ms 1.52×
P2 logs, logfmt, level not equal 1h 30 ms 31 ms 28 ms 1.11×
P3 logs, json, level existence 1h 122 ms 120 ms 84 ms 1.43×
P4 logfmt count by level 1h 30 ms 31 ms 42 ms 0.74×
P5 json count by level 1h 93 ms 91 ms 136 ms 0.67×
P6 json count, level filter 1h 15 ms 27 ms 133 ms 0.20×
P7 json rate by level, level regexp 1h 16 ms 20 ms 135 ms 0.15×
P8 json count by a name that is no stream label 1h 99 ms 100 ms 201 ms 0.50×
P9 instant logfmt by level instant 5 ms 6 ms 10 ms 0.60×
E1 json duration_ms sum by service 1h 103 ms 87 ms 169 ms 0.51×
E2 json duration_ms p95 by service 1h 425 ms 423 ms 165 ms 2.56×
E3 logfmt latency_ms rate, production 1h 508 ms 523 ms 990 ms 0.53×
E4 logfmt size_bytes max by service 1h 47 ms 47 ms 166 ms 0.28×
E5 json duration_ms sum, instant instant 38 ms 37 ms 27 ms 1.37×
E6 logfmt ttl unit string (Loki 400) 1h 400 400 400 —
E7 json hexadecimal trace_id (Loki 400) 1h 400 400 400 —
E8 json duration_ms sum by service, namespace prod 1h 187 ms 239 ms 584 ms 0.41×
E9 logfmt latency_ms sum by service, namespace prod 1h 308 ms 307 ms 691 ms 0.44×
U1 logfmt amount rate 1h 56 ms 37 ms 54 ms 0.69×
U2 json duration_ms rate 1h 88 ms 87 ms 138 ms 0.63×
U3 json duration_ms rate, error filter 1h 85 ms 86 ms 169 ms 0.51×
U4 logfmt latency_ms rate, production 1h 347 ms 366 ms 950 ms 0.39×
U5 logfmt amount rate, instant instant 7 ms 6 ms 11 ms 0.55×
U6 json duration_ms rate, instant instant 12 ms 13 ms 21 ms 0.62×
U7 json duration_ms sum_over_time, instant instant 15 ms 16 ms 21 ms 0.76×
U8 logfmt amount rate by service (grouped) 1h 43 ms 41 ms 57 ms 0.72×
U9 logfmt amount rate_counter (folded per series) 1h 278 ms 294 ms 269 ms 1.09×
U1 json duration_ms sum by service 1h 106 ms 84 ms 155 ms 0.54×
U10 instant sum_over_time unwrap instant 39 ms 33 ms 28 ms 1.18×
U11 instant max_over_time missing label instant 4 ms 4 ms 14 ms 0.29×
U12 json duration_ms over every service 1h 238 ms 236 ms 638 ms 0.37×
U13 logfmt latency_ms over every service 1h 522 ms 506 ms 904 ms 0.56×
U14 duration() of a unit string 1h 47 ms 45 ms 38 ms 1.18×
U2 json duration_ms max by service 1h 94 ms 92 ms 655 ms 0.14×
U3 json duration_ms sliding sum 1h 92 ms 85 ms 172 ms 0.49×
U4 logfmt size_bytes sum by service 1h 40 ms 39 ms 35 ms 1.11×
U5 logfmt ttl unit string (no sample) 1h 39 ms 40 ms 34 ms 1.18×
U6 missing label, no parser 1h 20 ms 19 ms 61 ms 0.31×
U7 missing label, ungrouped sum 1h 17 ms 17 ms 62 ms 0.27×
U8 rate of an unwrapped label 1h 89 ms 89 ms 150 ms 0.59×
U9 bytes() conversion 1h 61 ms 51 ms 48 ms 1.06×
Why these shapes
  • internal/translator/translator.go → 96: control/bytes_over_time by app, control/instant json filtered, control/instant json volume, control/instant ungrouped rate, control/json rate by level (no filter, no drop), control/json volume no filters, control/logfmt count by level, filter, drop, control/logfmt volume …
  • internal/proxy/ordered_json_metric.go → 75: control/bytes_over_time by app, control/instant json filtered, control/instant json volume, control/json rate by level (no filter, no drop), control/json volume no filters, control/logfmt count by level, filter, drop, control/logfmt volume, control/logs | json …
  • internal/proxy/metric_agg.go → 22: control/bytes_over_time by app, control/instant json volume, control/instant ungrouped rate, control/json volume no filters, control/stream-label count by app, control/topk rate by app, control/ungrouped rate, drilldown-breakdown-exact/DB1 label breakdown pod …
  • internal/proxy/vector_matching.go → 10: control/stream-label count by app, unwrap-ungrouped-sum/U1 logfmt amount rate, unwrap-ungrouped-sum/U2 json duration_ms rate, unwrap-ungrouped-sum/U3 json duration_ms rate, error filter, unwrap-ungrouped-sum/U4 logfmt latency_ms rate, production, unwrap-ungrouped-sum/U5 logfmt amount rate, instant, unwrap-ungrouped-sum/U6 json duration_ms rate, instant, unwrap-ungrouped-sum/U7 json duration_ms sum_over_time, instant …
  • control smoke → 8: control/drilldown service landing, control/instant ungrouped rate, control/json rate by level (no filter, no drop), control/json volume no filters, control/logs plain, control/logs | json, control/stream-label count by app, control/topk rate by app
  • internal/proxy/proxy.go (endpoint handler) → 8: control/drilldown service landing, control/instant ungrouped rate, control/json rate by level (no filter, no drop), control/json volume no filters, control/logs plain, control/logs | json, control/stream-label count by app, control/topk rate by app
  • shape added or edited → 6: label-replace/L1 label_replace over sum by rate, instant, label-replace/L2 label_replace over sum by rate, label-replace/L3 topk over label_replace over sum by count, label-replace/L4 label_replace over bare count_over_time, instant, label-replace/L5 label_replace over json sum by, instant, label-replace/L6 label_replace over json sum by

base 1e564ce47c → PR 9e0ba3fc0f · 4 runs (first is cold), warm p50 · ranges 1h · noise ±30% and 100 ms · VictoriaLogs restarts 0→0 · 11.2 min. Same runner, one fresh stack, targets interleaved per request. How to read and reproduce: bench/ab/README.md.

@github-actions

github-actions Bot commented Oct 12, 2026 •

Copy link
Copy Markdown
Contributor

PR Quality Report

Compared against base branch main.

Coverage and tests

Signal Base PR Delta
Test count 9698 9791 93
Coverage 87.8% 87.9% +0.1% (improved)

Compatibility

Track Base PR Delta
Loki API 100.0% 11/11 (100.0%) 0.0% (stable)
Logs Drilldown 100.0% 17/17 (100.0%) 0.0% (stable)
VictoriaLogs 100.0% 11/11 (100.0%) 0.0% (stable)

Performance smoke

Lower CPU cost (ns/op) is better. Lower benchmark memory cost (B/op, allocs/op) is better. Higher throughput is better. Lower load-test memory growth is better. Benchmark rows are medians from repeated samples.

Signal Base PR Delta
QueryRange cache-hit CPU cost 3384.0 ns/op 3391.0 ns/op +0.2% (stable)
QueryRange cache-hit memory 1240.0 B/op 1240.0 B/op 0.0% (stable)
QueryRange cache-hit allocations 27.0 allocs/op 27.0 allocs/op 0.0% (stable)
QueryRange cache-bypass CPU cost 3977.0 ns/op 4055.0 ns/op +2.0% (stable)
QueryRange cache-bypass memory 1301.0 B/op 1300.0 B/op -0.1% (stable)
QueryRange cache-bypass allocations 27.0 allocs/op 27.0 allocs/op 0.0% (stable)
Labels cache-hit CPU cost 896.4 ns/op 917.8 ns/op +2.4% (stable)
Labels cache-hit memory 48.0 B/op 48.0 B/op 0.0% (stable)
Labels cache-hit allocations 3.0 allocs/op 3.0 allocs/op 0.0% (stable)
Labels cache-bypass CPU cost 1502.0 ns/op 1466.0 ns/op -2.4% (stable)
Labels cache-bypass memory 399.0 B/op 399.0 B/op 0.0% (stable)
Labels cache-bypass allocations 14.0 allocs/op 14.0 allocs/op 0.0% (stable)

State

  • Coverage, compatibility, and sampled performance are reported here from the same PR workflow.
  • This is a delta report, not a release gate by itself. Required checks still decide merge safety.
  • Performance is a smoke comparison, not a full benchmark lab run.
  • Delta states use the same noise guards as the quality gate (percent + absolute + low-baseline checks), so report labels match merge-gate behavior.

@github-actions

github-actions Bot commented Oct 12, 2026 •

Copy link
Copy Markdown
Contributor

✅ Visual smoke: passed

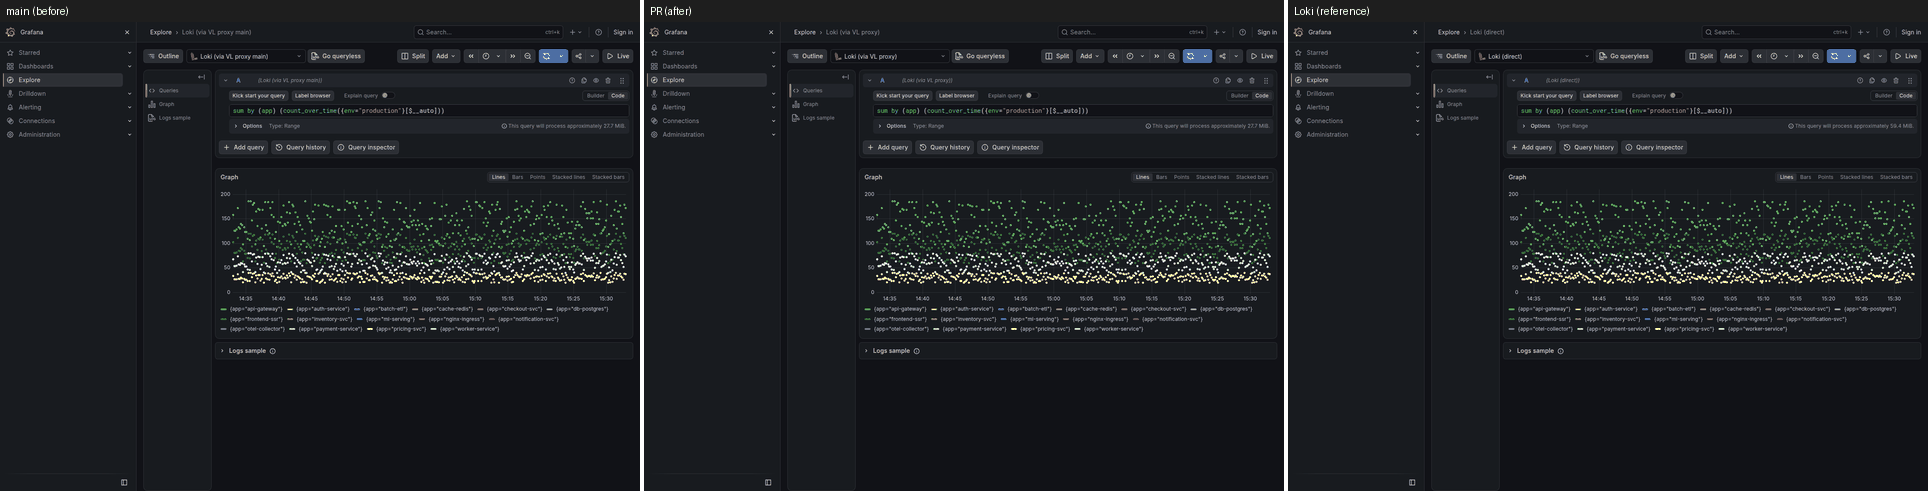
Base 1e564ce47c vs PR abf6819ade, Grafana through the proxy builds and Loki on one fresh stack; run.
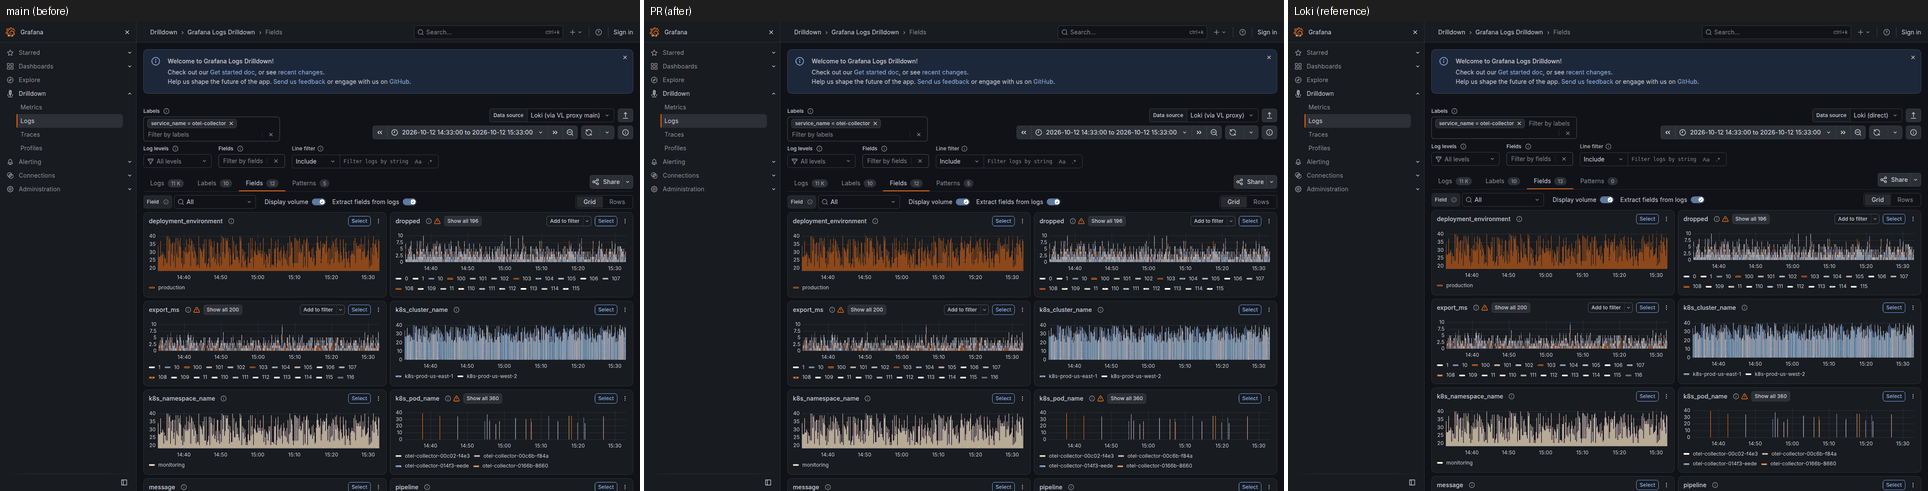
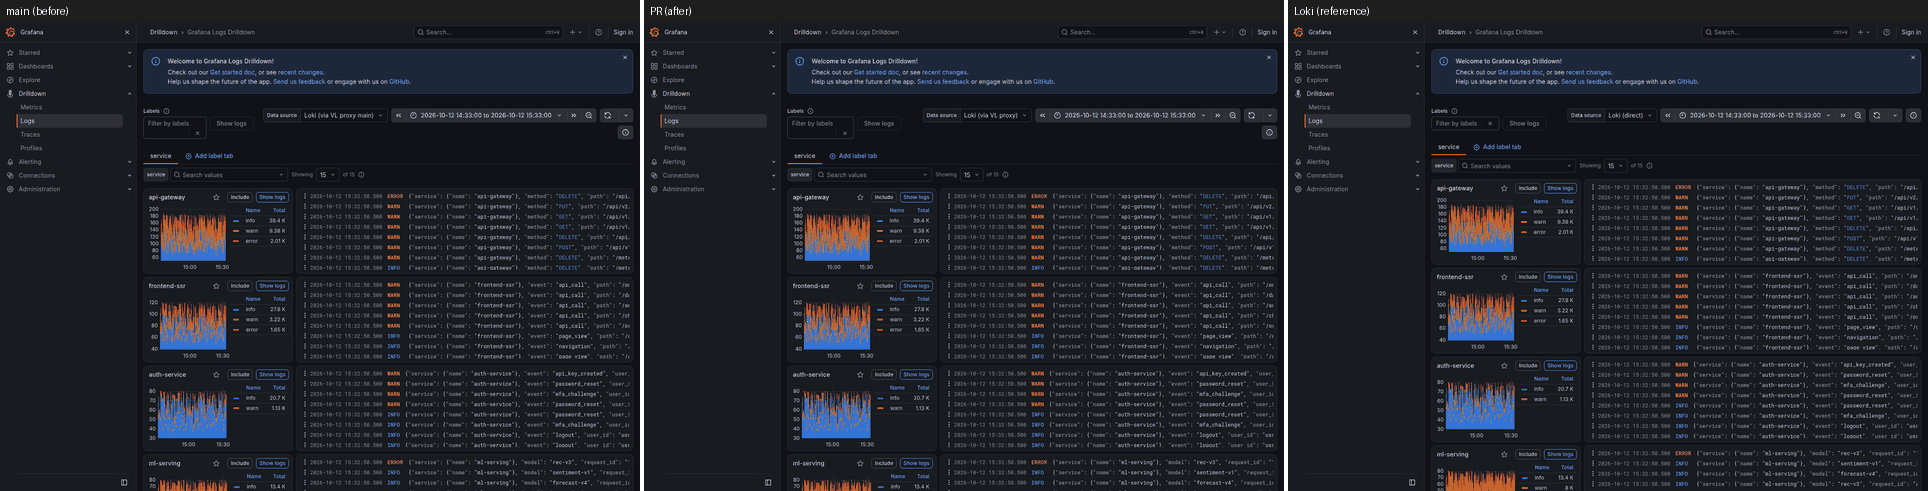
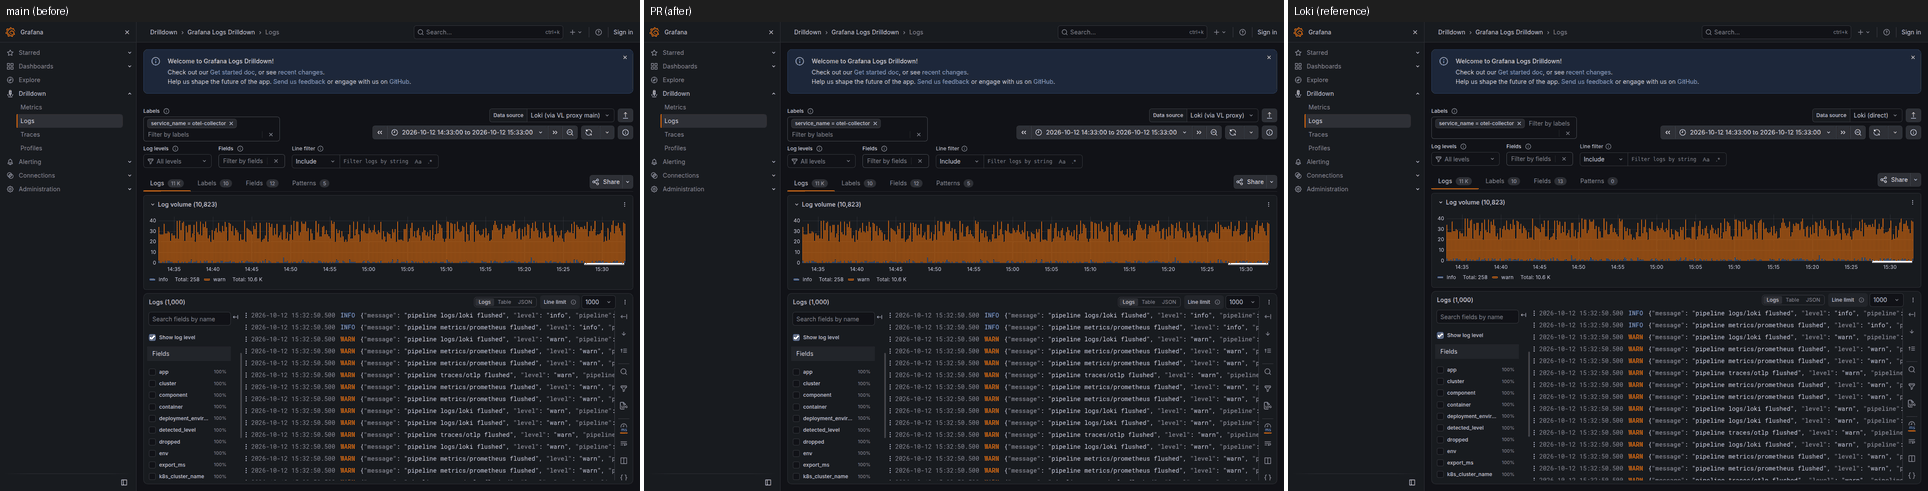
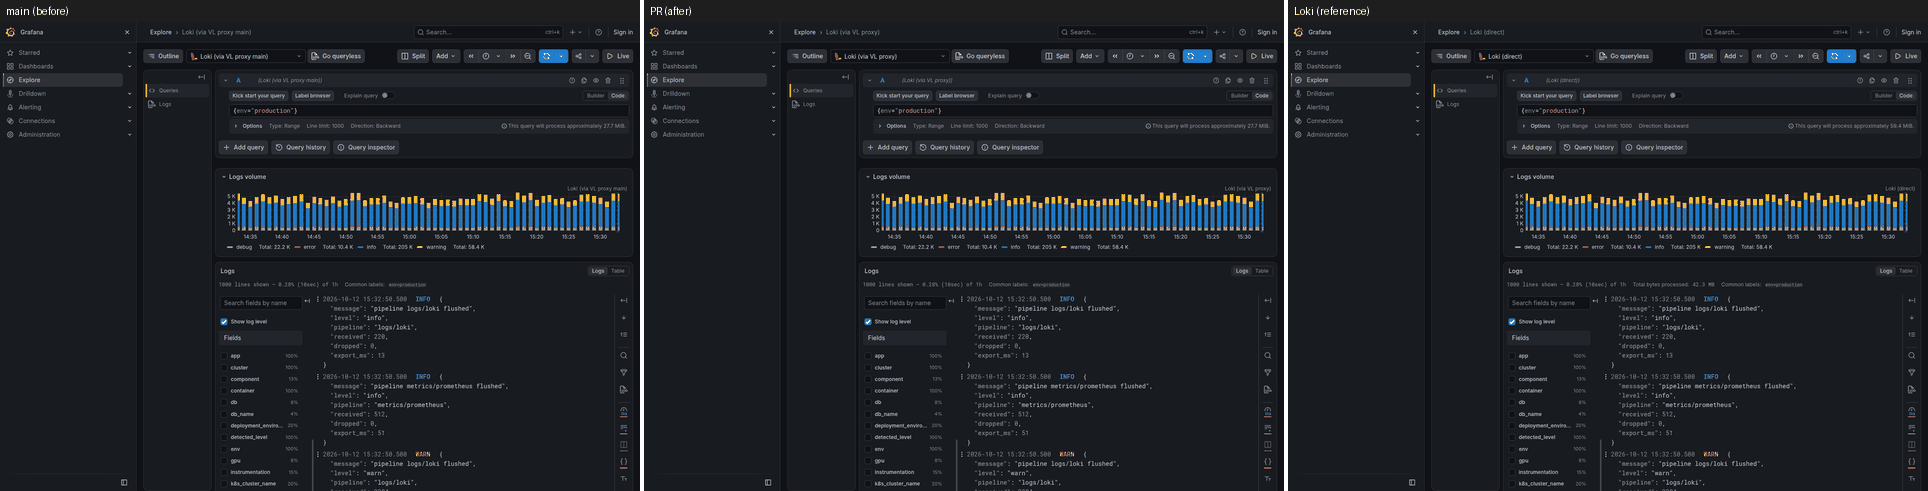
Core set: 5 capture(s) at 1h. Detailed set: 26 entries (explore-metric-plain, explore-A, explore-B, explore-C, explore-E, explore-F, explore-logs-json, explore-logfmt-metric, ...). 32 capture(s), 15m/1h/6h, 24h and 7d stay out of PR runs.
Trimmed to the 1h range for the capture budget: explore-A, explore-B, explore-C, explore-E, explore-F, explore-logs-json, explore-logfmt-metric, explore-logs-extracted, explore-extracted-metric, explore-extracted-filter-metric, explore-extracted-group-metric, explore-logs-plain-level, explore-plain-level-metric, explore-logs-line-filter-or, explore-metric-line-filter-or, explore-unwrap-sum, explore-unwrap-unit-string, explore-unwrap-missing-label, explore-unwrap-conversion-error, explore-unwrap-rate-sum, explore-empty-pattern-filter, dd-labels-namespace, dd-field-service_version, dd-field-pipeline.

Fix proof

Captures of the exact cases this pull request adds or fixes (registry case, base | PR | Loki). The verdict compares the PR with Loki where the base did not match. The gate fails a case unless one capture is fixed or improved, or, beyond the Loki data window, the base failed where Loki and the PR both answered with data (the label does not excuse it; only visual: none on the case does).

  • semantics/label-replace-new-label: no visual proof, exempt: the visible difference is on instant queries; the visual harness captures Explore range panels (queryType range), where label_replace already matched, so the fix is proven by the instant tests and the

Regression check

page range set base = PR (data) vs Loki (PR) pixel diff result
dd-fields 1h core ✅ identical identical (4 explained, 1 history-dependent) 0.11% ✅
dd-landing 1h core ✅ identical identical (3 explained) 0.13% ✅
dd-service-logs 1h core ✅ identical identical (3 explained, 1 history-dependent) 0.11% ✅
explore-logs-plain 1h core ✅ identical identical (1 explained) 0.07% ✅
explore-metric-plain 1h core ✅ identical identical (1 explained) 0.04% ✅
dd-field-pipeline 1h detailed ✅ identical identical (3 explained, 1 history-dependent) 0.11% ✅
dd-field-service_version 1h detailed ✅ identical identical (3 explained, 1 history-dependent) 0.11% ✅
dd-labels-namespace 1h detailed ✅ identical identical (3 explained, 1 history-dependent) 0.11% ✅
explore-A 1h detailed ✅ identical identical (1 explained) 0.04% ✅
explore-B 1h detailed ✅ identical identical (1 explained) 0.04% ✅
explore-C 1h detailed ✅ identical identical (1 explained) 0.04% ✅
explore-E 1h detailed ✅ identical identical (1 explained) 0.04% ✅
explore-F 1h detailed ✅ identical identical (1 explained) 0.04% ✅
explore-empty-pattern-filter 1h detailed ✅ identical identical (1 explained) 0.07% ✅
explore-extracted-filter-metric 1h detailed ✅ identical identical (1 explained) 0.04% ✅
explore-extracted-group-metric 1h detailed ✅ identical identical (1 explained) 0.04% ✅
explore-extracted-metric 1h detailed ✅ identical identical (1 explained) 0.04% ✅
explore-logfmt-metric 1h detailed ✅ identical identical (1 explained) 0.04% ✅
explore-logs-extracted 1h detailed ✅ identical identical (1 explained) 0.07% ✅
explore-logs-json 1h detailed ✅ identical identical (1 explained) 0.07% ✅
explore-logs-line-filter-or 1h detailed ✅ identical identical (1 explained) 0.07% ✅
explore-logs-plain-level 1h detailed ✅ identical identical (2 explained) 0.07% ✅
explore-metric-line-filter-or 1h detailed ✅ identical identical (1 explained) 0.04% ✅
explore-metric-plain 15m detailed ✅ identical identical (1 explained) 0.04% ✅
explore-metric-plain 6h detailed ✅ identical n/a (beyond the Loki window) 0.04% ✅
explore-plain-level-metric 1h detailed ✅ identical identical (1 explained) 0.04% ✅
explore-unwrap-conversion-error 1h detailed ✅ identical 1 difference(s), 1 on base too; 1 explained 0.04% ✅
explore-unwrap-missing-label 1h detailed ✅ identical identical (1 explained) 0.04% ✅
explore-unwrap-rate-sum 1h detailed ✅ identical identical (1 explained) 0.04% ✅
explore-unwrap-sum 1h detailed ✅ identical 1 difference(s), 1 on base too; 1 explained 0.04% ✅
explore-unwrap-unit-string 1h detailed ✅ identical identical (1 explained) 0.04% ✅
tail-json-filter live detailed ✅ identical entries in the window: PR 1904, Loki 667, in both 667 5.28% ✅

Gate: a base-vs-PR data difference passes when the PR is closer to Loki, and fails when the PR diverges from Loki or Loki cannot decide it (at a range Loki does not hold, a difference passes when the same page proved it closer to Loki at a shorter range; otherwise label the pull request visual-change-expected to accept an intended change). Also failing: a panel empty on the PR but not on the base, an error banner, panel error, error answer or new "No data" panel on the PR, a PR side that never settled, a difference that did not reproduce on the recapture. Pixel differences only warn.

Core set montages (5): base | PR | Loki

dd-fields-1h

dd-fields-1h

dd-landing-1h

dd-landing-1h

dd-service-logs-1h

dd-service-logs-1h

explore-logs-plain-1h

explore-logs-plain-1h

explore-metric-plain-1h

explore-metric-plain-1h

All montages of this run: pr-visuals/pr-744.

@szibis
szibis force-pushed the fix/label-replace-new-label branch from 3f174b0 to a52da44 Compare October 12, 2026 11:50
@github-actions github-actions Bot added size/XL Extra large change and removed size/XL Extra large change labels Oct 12, 2026
@szibis
szibis force-pushed the fix/label-replace-new-label branch from 17c6e6b to 45187a3 Compare October 12, 2026 13:52
@github-actions github-actions Bot added size/XL Extra large change and removed size/XL Extra large change labels Oct 12, 2026
@szibis
szibis force-pushed the fix/label-replace-new-label branch from 45187a3 to c9c6d52 Compare October 12, 2026 15:03
@github-actions github-actions Bot added size/XL Extra large change and removed size/XL Extra large change labels Oct 12, 2026
Comment thread internal/proxy/ordered_json_metric.go Fixed
…reads escaped regexps

The transform ran on range matrices only, so an instant vector came back
without the new label. It now rewrites the labels of a vector and of a matrix
alike, keeps the rest of the answer, expands the replacement as Loki does and
files the points of series that end with one label set under one series on a
range query, as JoinSampleVector does.

The string arguments are unquoted like the LogQL lexer does, a call without
the four string arguments is a 400 parse error, topk/sort/stddev over a
label_replace no longer send the translator's marker to VictoriaLogs, a
label_replace around a binary expression on query_range routes by the
expression under it, and the without marker no longer swallows the markers
that follow it.
… the expression under it, and reports Loki's argument errors

The series of a label_replace answer are ordered by label set after the
transform (a range result, and an instant vector unless the query sorts by
value). The request is cloned once, above the routing chain, when a label
transform wraps the expression. A malformed call reports the token names and
the string start column of Loki's parser. label_join is no longer claimed as
a feature of the transform. Ranking over duplicate label sets that a
label_replace produced is registered as an open row.
…stream, and around a json metric keeps the parser-error semantics

An instant label_replace(count_over_time(...)) lost the grouping by stream
(the check looked for a query that starts with the function) and answered one
unlabeled total. A label_replace around a metric over | json skipped the
evaluator that owns JSON parser errors and answered 200 for lines Loki fails
or drops. Both now follow the expression under the transform; the e2e leaves
the structured metadata Loki adds to a bare range function's series (an
owner-kept deviation) out of the comparison and ranks one series under topk
so ties do not decide the shape.
@szibis
szibis force-pushed the fix/label-replace-new-label branch from c9c6d52 to d7da182 Compare October 12, 2026 15:09
@github-actions github-actions Bot added size/XL Extra large change and removed size/XL Extra large change labels Oct 12, 2026

This branch has not been deployed

No deployments
Sign up for free to join this conversation on GitHub. Already have an account? Sign in to comment

Labels

bugfix Bug fix scope/docs Documentation scope/proxy Proxy core scope/tests Tests scope/translator LogQL translator size/XL Extra large change

Projects

None yet

Development

Successfully merging this pull request may close these issues.

2 participants