
Automatic data retrieval, descriptive stats, plotting and regression for the sleep data from the Jawbone UP3 fitness tracker
I own a Jawbone UP3 fitness tracker, which I wear at night to track how long I sleep and how much light, deep and REM sleep I get. This repo contains some code I've written to automatically retrieve my data from the Jawbone website and to do some statistics and visualization.
The script jawbone.py, when run from the command line, will retrieve the data, print some statistical information to standard output, and create a PDF file with some plots. As detailed below, it expects files called cookies.txt and lifestyle_variables.csv to be present in the same directory. jawbone.py takes one argument: the calendar year for which to retrieve data (e.g. jawbone.py 2017).
Requires numpy, pandas, pyplot, and statsmodels.
Jawbone allows users to download their data for a specified calendar year after they have logged in to the Jawbone website. My code sends a request using a cookie that the website gives me when I log in. If you have an account on the Jawbone website and want to use the code, do the following:
- Log in to the Jawbone website
- Look up the value of the cookie named
jbsessionfrom jawbone.com - create a file called
cookies.txt, containing this value, in the same directory as the code
The main reason I wrote this code was to explore how day-to-day lifestyle factors, like exercise or taking sleeping pills, affect my sleep. I record these in a file called lifestyle_variables.csv. (If this file is not provided, the script will still run, but without this functionality.)
The lifestyle_variables.csv file should begin with a comma-separated list of variable names. The first column should be called date_after and contains a date in m/d/yy format. This date is the day after the day for which the variables are being recorded. (E.g., I make certain lifestyle choices on 9/5/17; I go to sleep that night; in the morning I record those choices in a new row, with the date_after value '9/6/17', which conveniently is the current date as I am entering data.) The other columns can represent any number of user-chosen and user-named variables, assumed to be continuous (and converted to floats internally).
The script produces three kinds of output:
-
Summary statistics on total sleep time, time in each sleep stage (in minutes), percentage of sleep spent in each sleep stage, time of sleep onset (relative to midnight), and lifestyle variables (if provided)
-
If lifestyle variables are provided, statistics from regressions (see below)
-
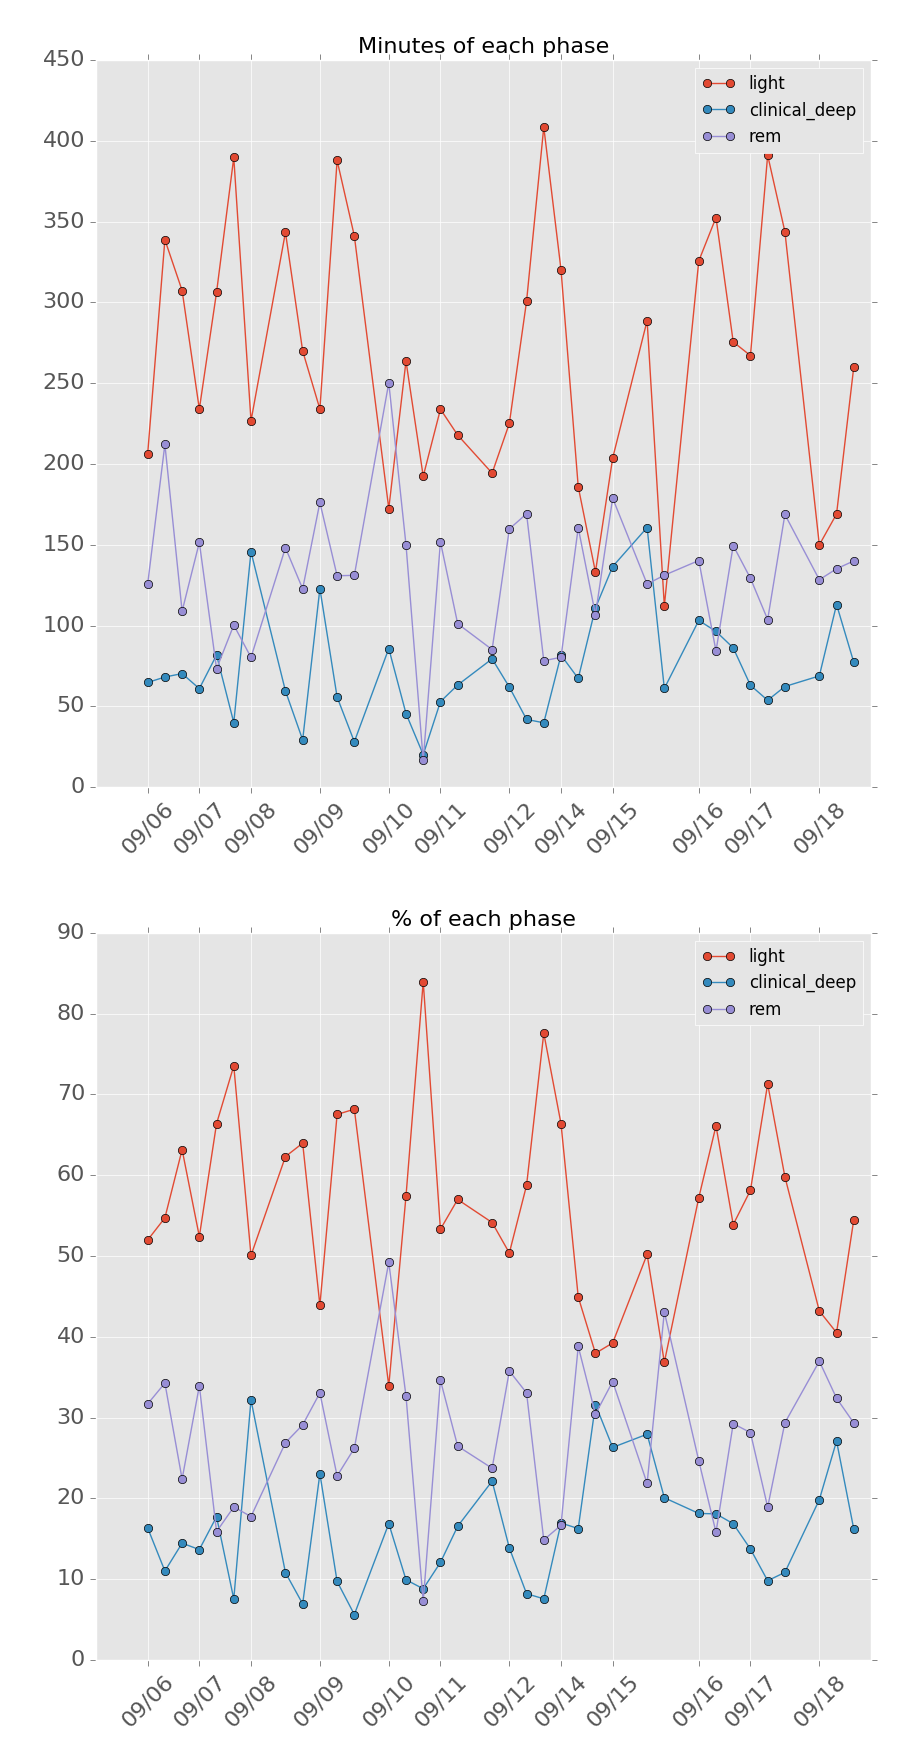
Two time series plots, one for time in each sleep stage (in minutes) and one percentage of sleep spent in each sleep stage, saved to a file called
time_series_plots.pdf
(To do: change 1 and 2 from outputting via print statements to outputting in a more flexible way)
Example output is given in the files example_output.txt and example_plots.pdf. Here's what the plots look like:
To explore how lifestyle variables may affect sleep variables, I perform linear regressions of total sleep time and time in each sleep stage on a set of independent variables. This set includes lifestyle variables, time of sleep onset, and total sleep time (except when it is the independent variable). I include the latter two because sleep stages are not evenly distributed across the night: typically deep sleep occurs earlier in the night and REM later. So we would expect that nights with lower total sleep time might have less REM. There is also evidence that this pattern is set (partially?) by the circadian rhythm, so that REM is more likely at particular times of night, not just at particular offsets relative to the start of sleep. Thus time of sleep onset may also effect the amount of deep and REM sleep, and so I include it as an independent variable.
Regression is a flawed instrument for inferring causation in situations like this one. For instance, suppose I find that a given lifestyle variable, L, has a negative coefficient in the total sleep time regression, with a low p-value. Does this mean L causes me to sleep less? What if L represents something (such as exercise) I do more often when I want to counteract stress, and I have a harder time getting to sleep on stressful days? Then the negative coefficient would reflect stress (an unmeasured variable) causing lower sleep, not L. (In fact, L itself might have a positive influence on total sleep time, or no influence at all.) Due to this kind of concern, I have been exploring other methods of causal inference as well (see below).
Additionally, the p-values and confidence intervals from linear regression assume that the data are sampled independently from some joint distribution. For a time series with some autocorrelation, this will not be a good assumption. When studying my own sleep data, I've found that there are no autocorrelations significantly different from zero, but it would be good to add this computation to the code and warn the user (or correct the statistics) if significant autocorrelations are found.
The code computes, but does not report, a proxy for REM latency (i.e. the amount of time before the REM-heavy segment of sleep begins). I may do more with this proxy in the future if I convince myself it's useful.
As noted above, it can be difficult to make confident causal inferences from regressions in cases like this one. I have written code to search for causal structure using the causal discovery package Tetrad. the causal search algorithms in this package can find more or less structure depending on parameters given by the user, analogous to the alpha cutoff for p-values. I would like to incorporate this code into the public version of this repo after I become more confident about how to set these parameters and how to interpret the output.
As noted above, I would like to add autocorrelation calculations to the script, although I have found no significant autocorrelation in my own sleep data.