
Cloudflare Web Analytics on the EmDash dashboard, and next to your content.
Most analytics plugins either inject a script or show site-wide numbers.
This one keeps a path → entry index, so views can be attributed to the
entry that earned them rather than to a URL string.
Status: early releases. Cloudflare Web Analytics plus demo data: a dashboard widget, an Analytics page with a setup check, a per-entry page, an Analytics panel in the entry editor and four read-only MCP tools. Needs EmDash 1.0.1 or later. See "Not in this version".
The screenshots show demo data on a site made from EmDash's blog template.
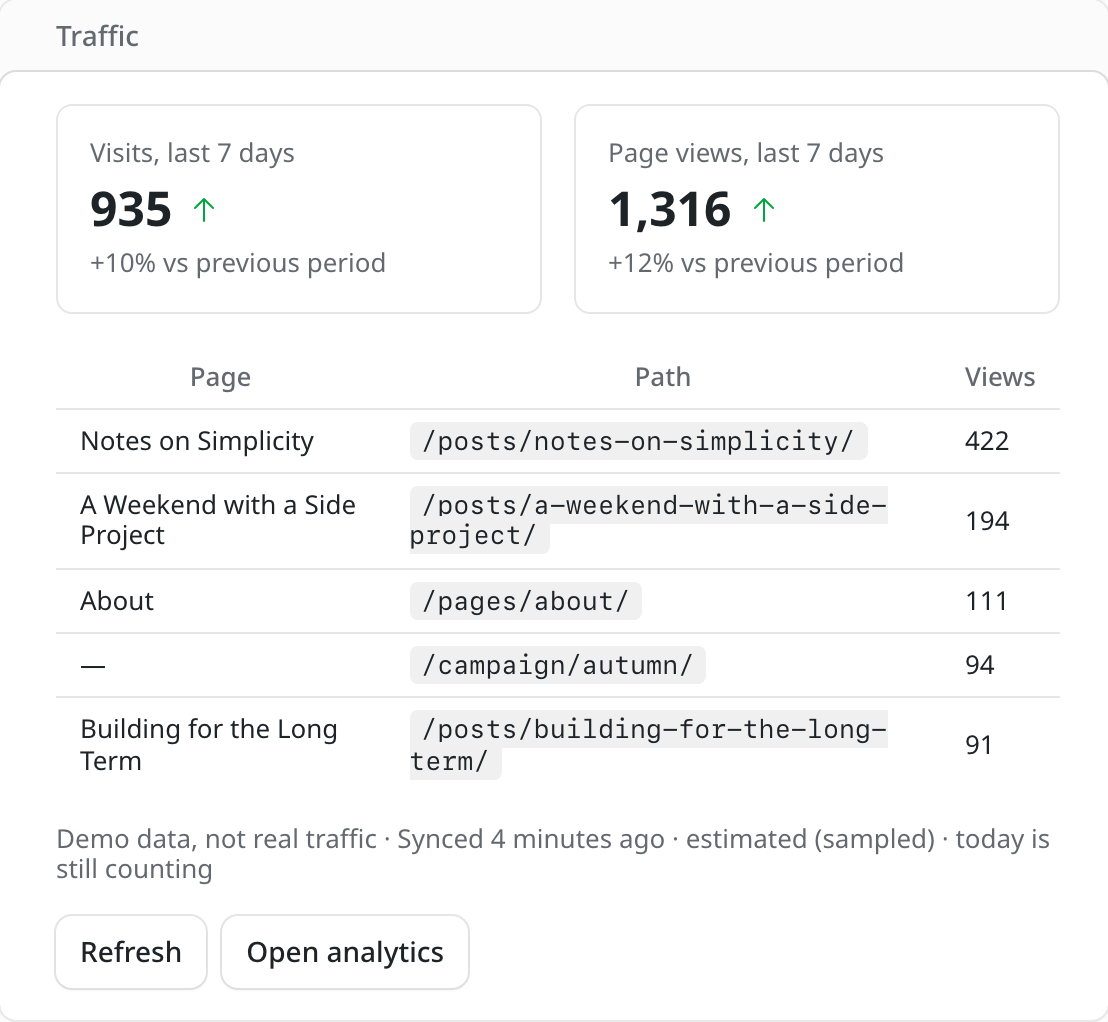
A Traffic card on the dashboard: visits and page views for the last seven days against the week before, the five most viewed pages with the entry they belong to, and when the numbers were last synced.
Plugins → Analytics in the admin sidebar, or "Open analytics" on the dashboard widget. Editors and admins see it.
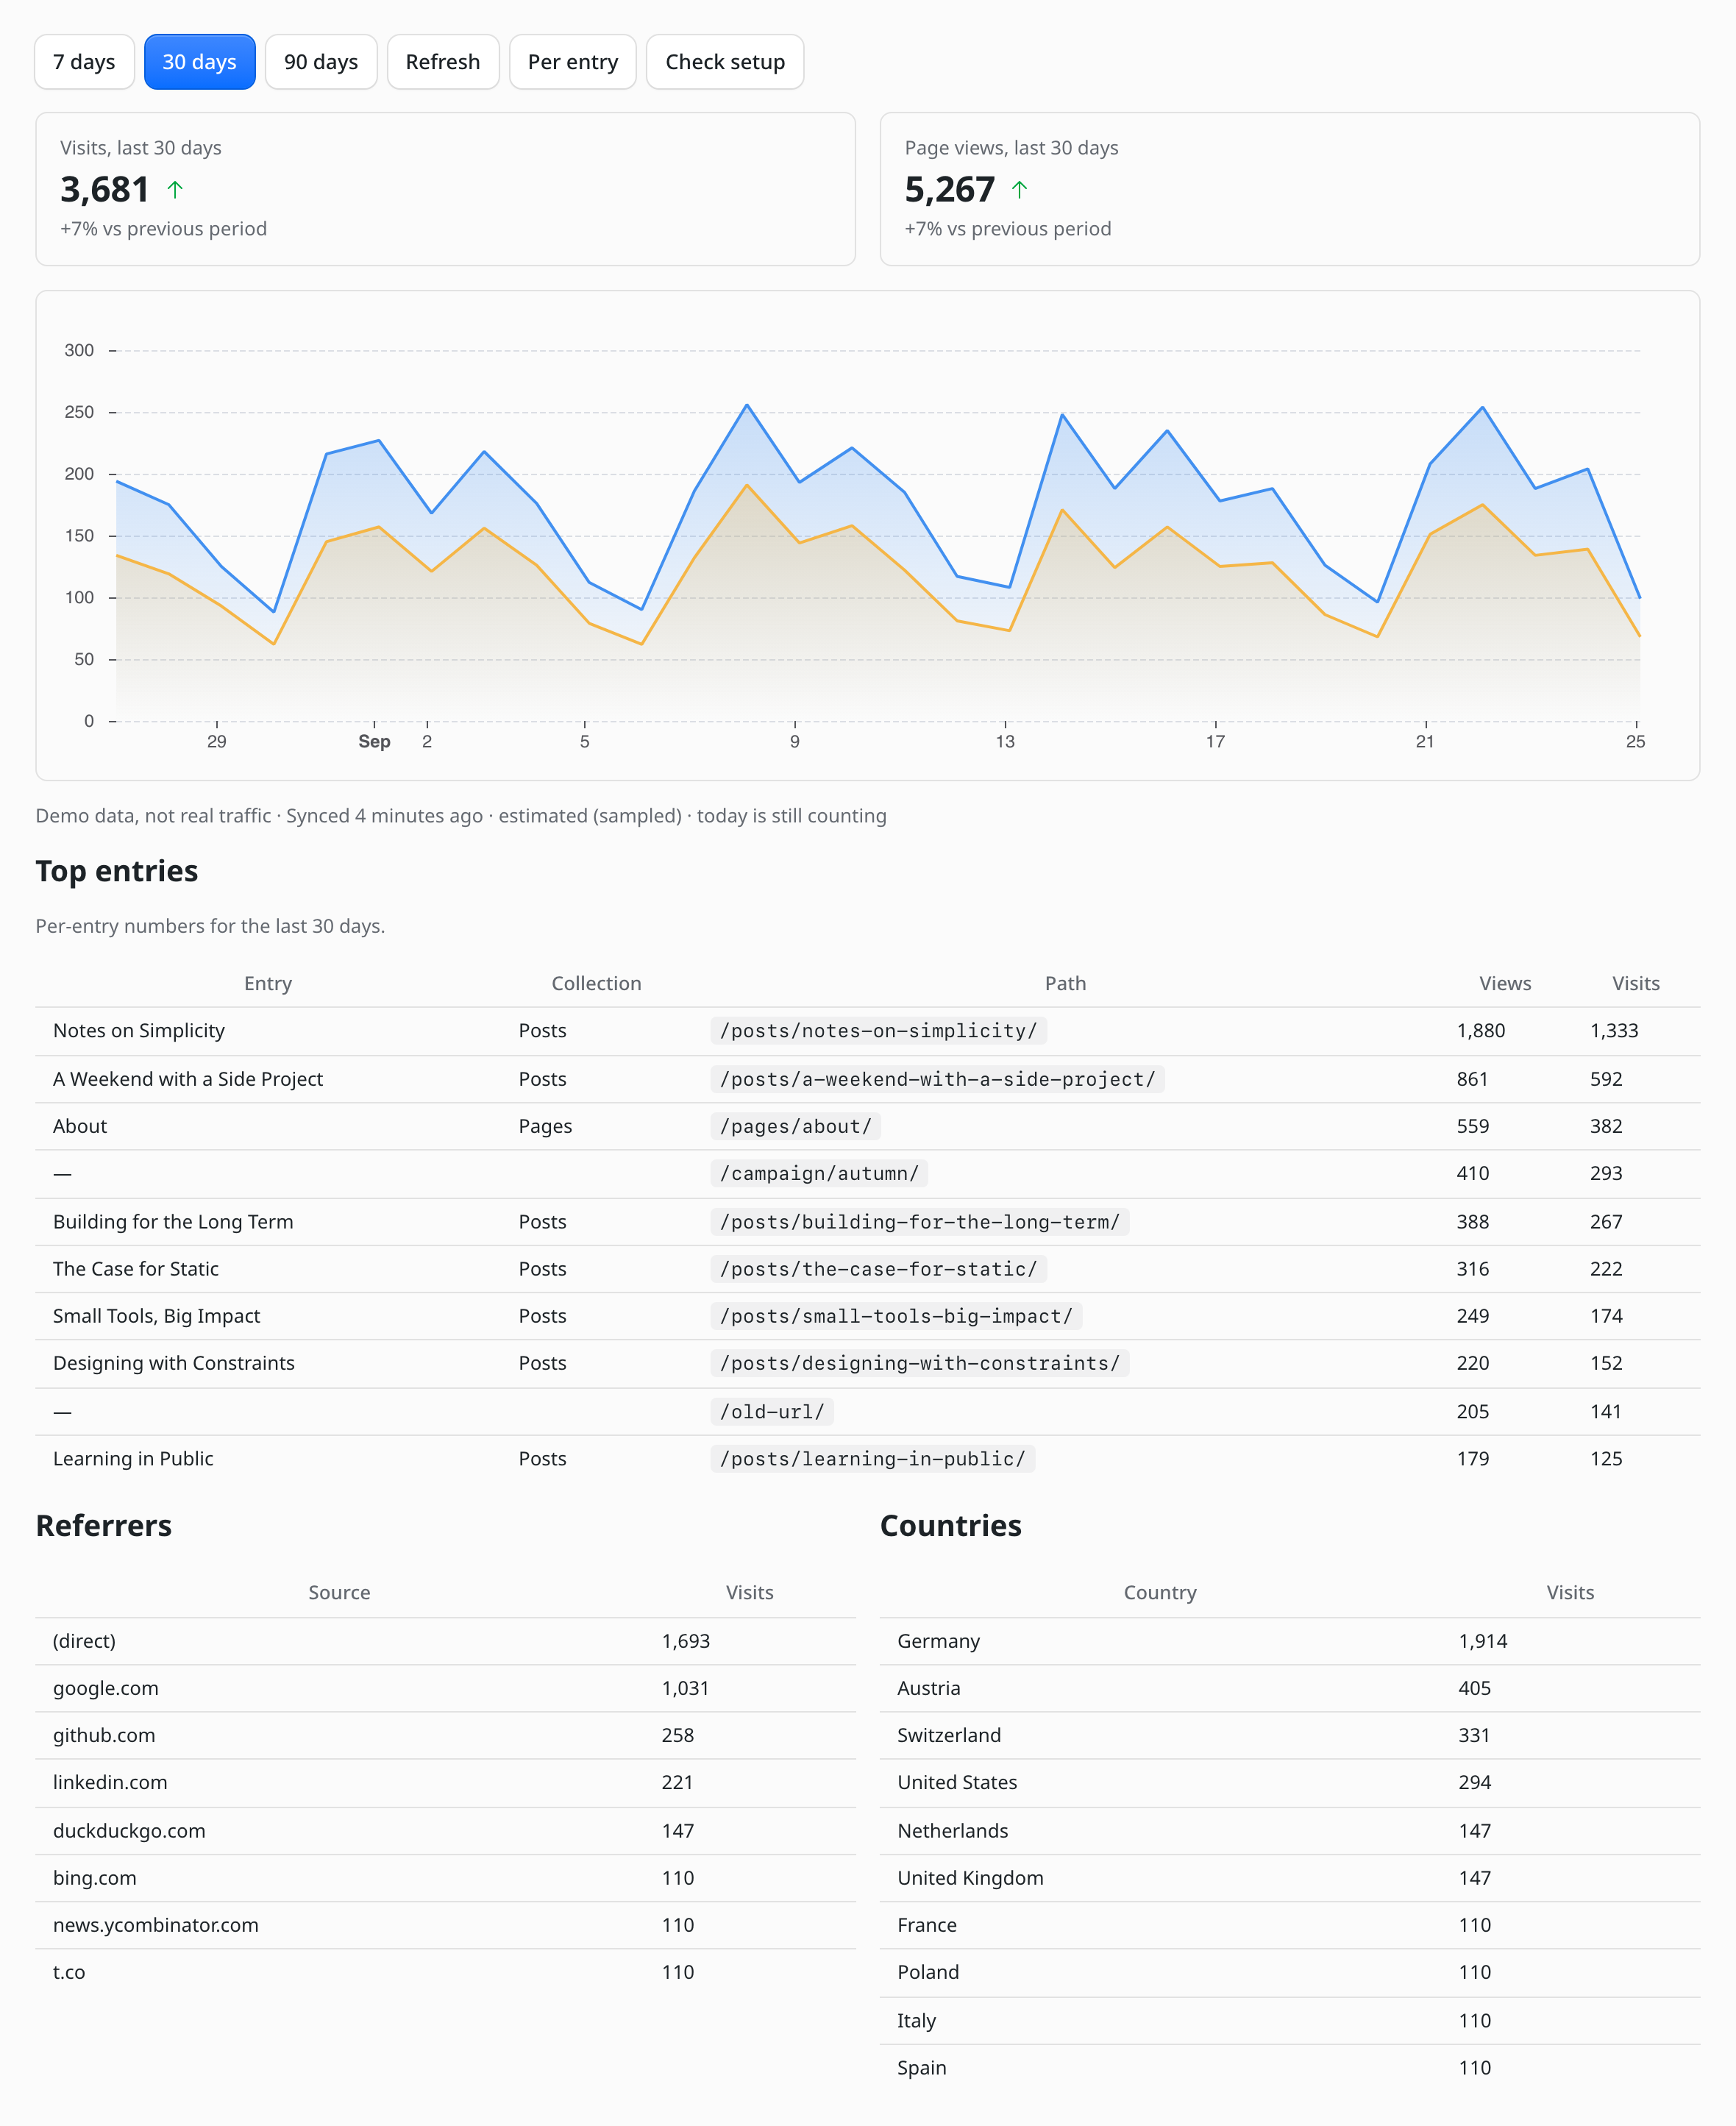
The page asks the provider live on every load, so it has numbers from the first minute after setup; it does not wait for the sync. It only ever asks for the days the provider still counts exactly (for Cloudflare, the last 7 days and today); older days come from the plugin's own store. On a new install a 30- or 90-day range therefore starts at the first exact day and says so, instead of showing Cloudflare's sampled figures, which on a small site can be off by a factor of ten. If the live request fails, the page shows the store alone.
- Range: last 7, 30 or 90 days. Visits and page views with the change against the previous period of the same length, shown only once stored history reaches back that far.
- A daily chart of page views and visits. Days the provider reported nothing are left out rather than drawn as zero.
- Top entries with path, and title and collection once the plugin has matched the page to an entry.
- Referrers and countries, read live for the days the provider counts exactly (the last week on Cloudflare), so on a 30- or 90-day range they cover the last week and say so.
- "Open in Cloudflare" goes to this site's view in the Cloudflare dashboard.
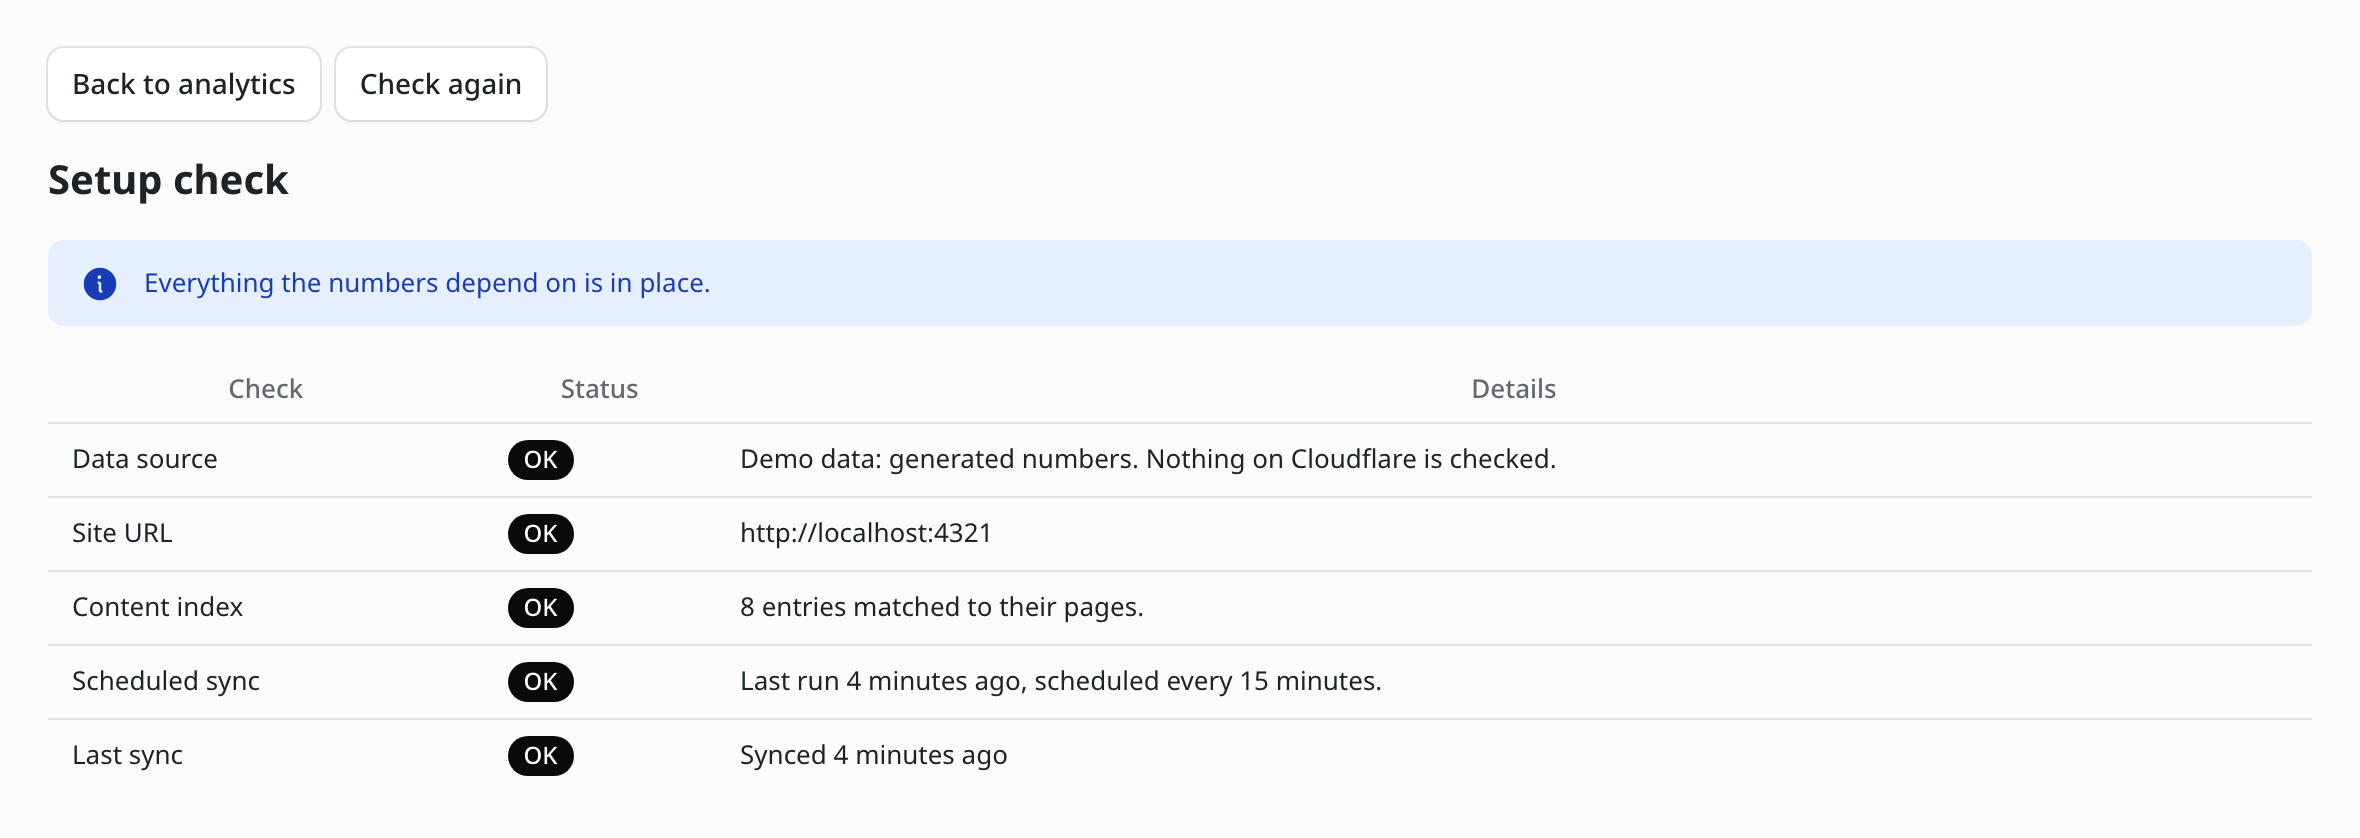
Check setup on the Analytics page runs every check the numbers depend on, in the order a fix has to happen: data source, API token and account, Cloudflare access, site tag, hostnames, site URL, content index, scheduled sync and last sync. Each problem gets one sentence that names the fix.
Most setup mistakes do not fail, they produce zeroes: a beacon token pasted as the site tag, a hostname filter that leaves out the host Cloudflare reports, a site without a stored URL, a Worker without a Cron Trigger. None of them raises an error the sync could report, which is why the check exists. When the site tag or the hostname filter is wrong, it lists the site tags on the account with their hostnames and the last week's page views, so the right one can be copied into the settings.
The check only reads; values are entered in the plugin's settings form. It makes one request to Cloudflare.
Plugins → Analytics per entry, or "Per entry" on the Analytics page.
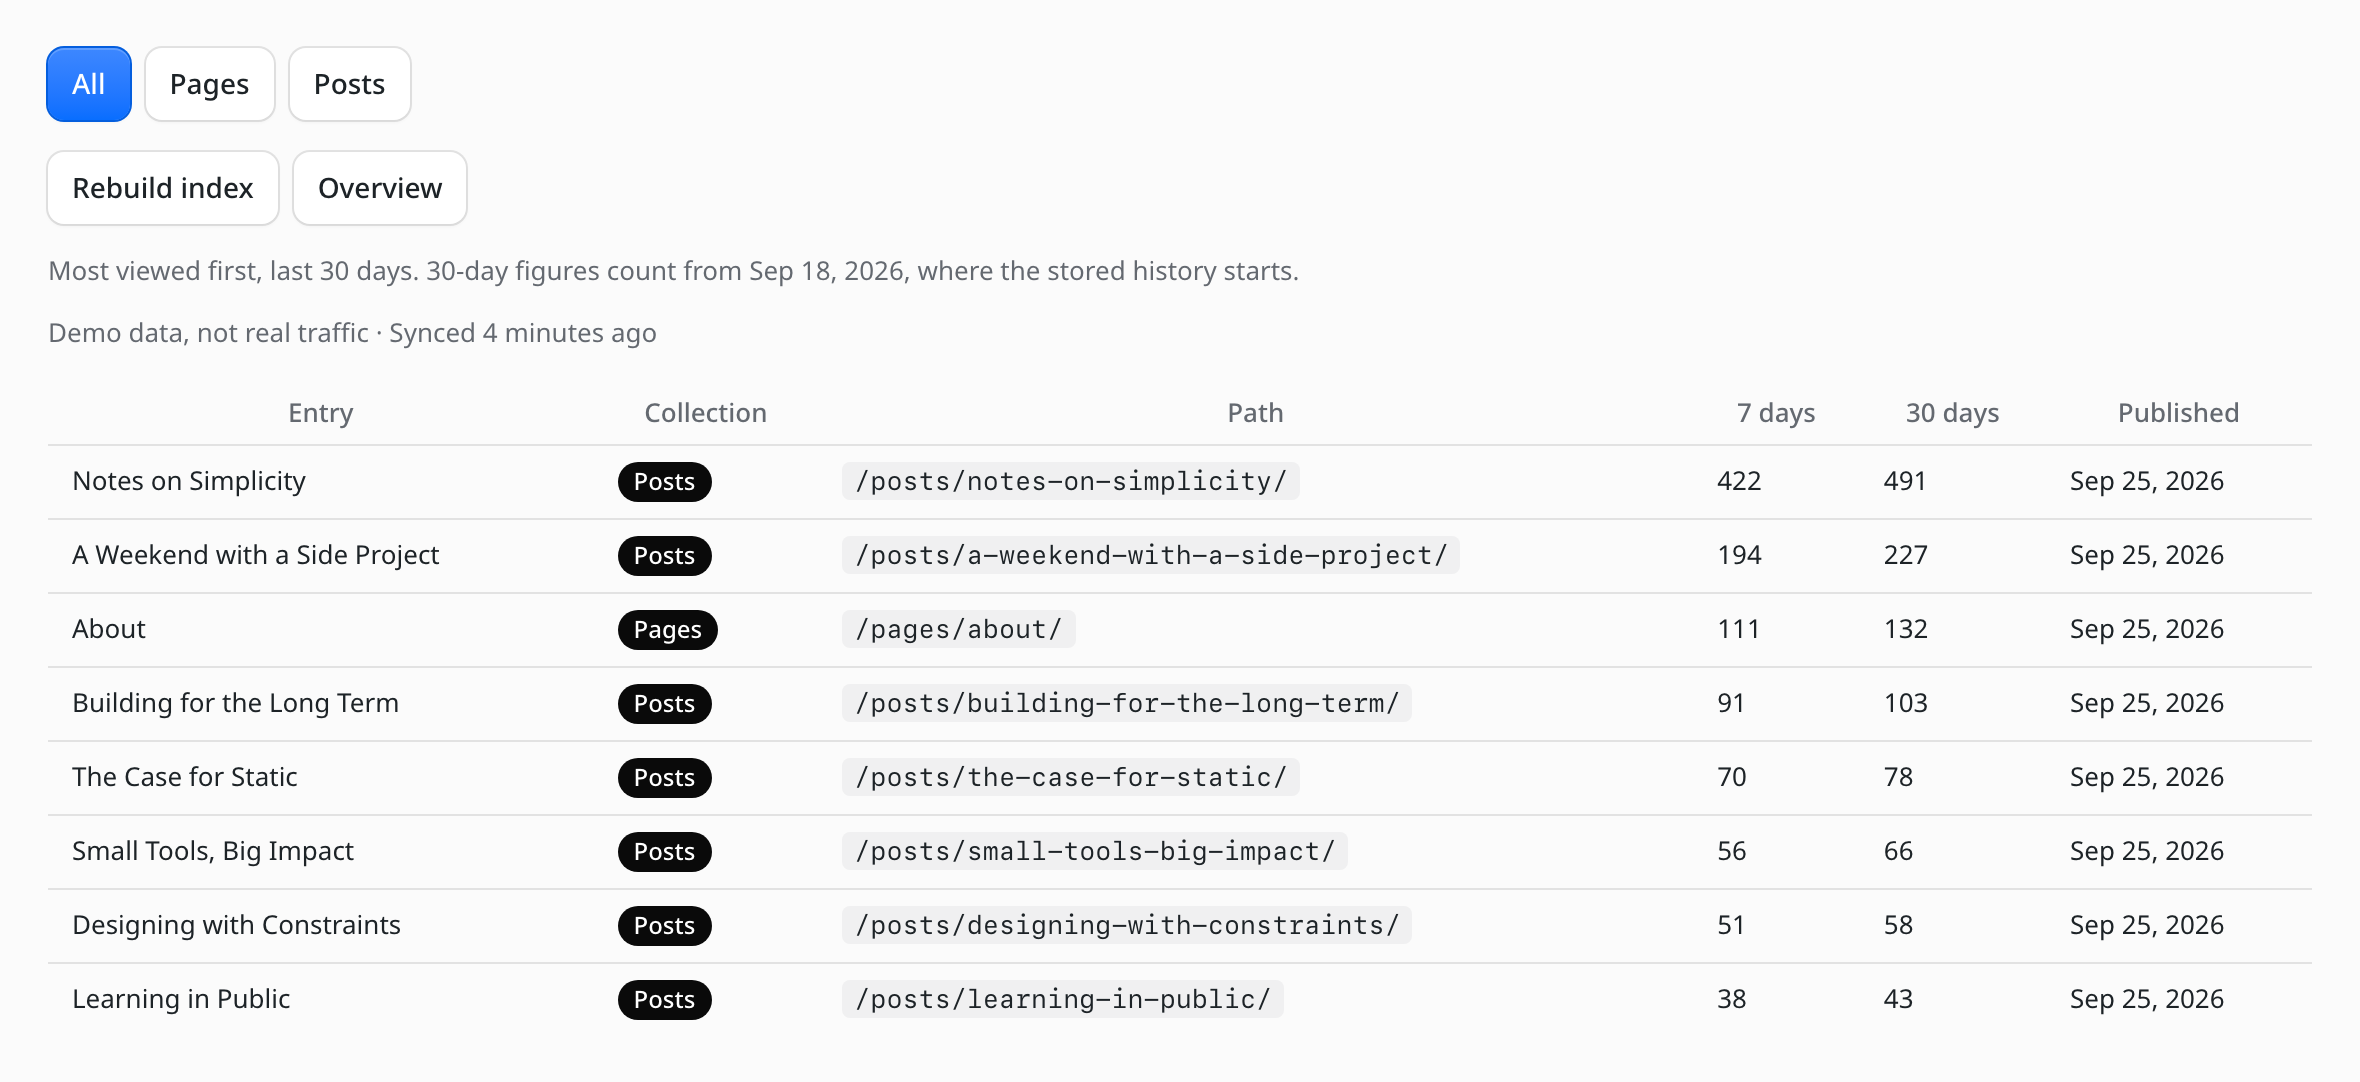
Every published entry with its page views over the last 7 and 30 days, today included, by collection or across all of them. Click a column header to sort; sorting ascending puts the entries nobody visited first, which Cloudflare's own dashboard cannot show, because it only knows paths that got traffic. The publish date says when a small number just means a young entry.
On a site with translations, each row also shows the 30-day total of all its languages, and Languages combined shows one row per translated piece of content with each language's share. That mode groups the first 300 entries in the chosen order and says so when there are more.
How the numbers are made: the last eight days come from the provider on every sync, exactly. The 22 days before them come from the plugin's own store, summed once a day, because Cloudflare only answers for older days from a sample. So the 30-day figures cover 30 days only once the plugin has been running for about three weeks, and the page says where they start until then.
Rebuild index walks the site's content again. The plugin keeps its page-to-entry index current from the content hooks and catches up on existing content by itself; a rebuild is for a changed URL pattern or site URL.
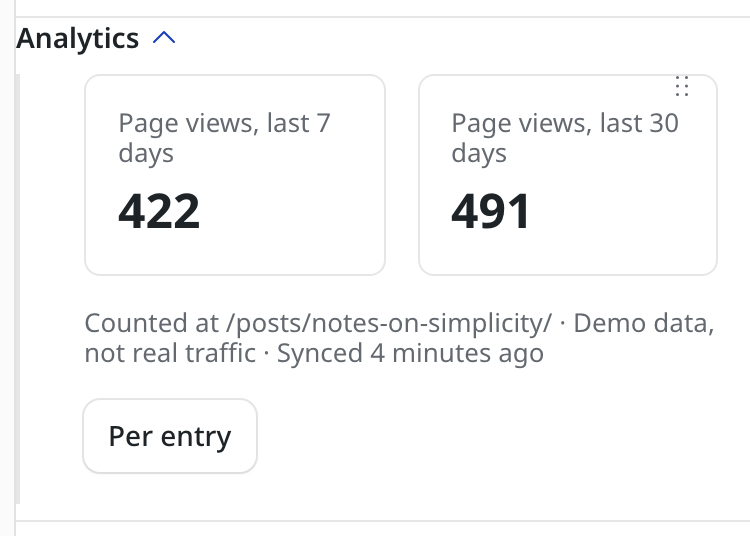
In the entry editor, the Analytics panel shows that entry's 7- and 30-day page views and the path they are counted at, and on a translated entry each language's numbers and their total. An entry that is not published at a public URL says so instead.
EmDash's MCP server can hand the same numbers to an AI agent. The plugin declares four read-only tools:
| Tool | Answers |
|---|---|
analytics__top_entries |
The most viewed published entries over 7 or 30 days, optionally for one collection |
analytics__unviewed_entries |
Published entries without a single view in 7 or 30 days |
analytics__entry_views |
One entry's 7- and 30-day views, found by id or by path, with its translations and their total |
analytics__site_totals |
Site visits and page views over 7, 30 or 90 days, against the period before |
They read what the sync stored and never call Cloudflare. Every answer names its window in UTC days, where stored history starts, whether the content index is complete and when the last sync ran, so an agent can say that the data is thin instead of presenting it as exact.
To use them:
- Under Plugins, open Analytics and turn on Agent access after reviewing the tools.
- Call them as a user with
plugins:read(editor and above), through a token with themcp:tools:analyticsscope, ormcp:toolsfor every plugin's tools.
After an update that changes a tool, EmDash stops serving the tools until they are approved again, but the switch stays on. Turn it off and on.
| EmDash | >=1.0.1, the first stable release. Sites on 0.x keep the plugin version they have; 0.2.x supports EmDash 0.39 and later |
| A Cloudflare account | with Web Analytics enabled for the site |
| An API token | permission Account → Account Analytics → Read |
EMDASH_ENCRYPTION_KEY |
set on the site, or the API token cannot be stored (npx emdash secrets generate) |
| URL patterns | each collection needs a URL Pattern (under Content Types), or no page can be matched to its entry. Sites made from EmDash's blog template start without them; the setup check says so |
| Scheduled tasks | the sync runs as a plugin cron task. On Cloudflare Workers that needs the Cron Trigger and scheduled handler from EmDash's Cloudflare deployment guide; on Node, EmDash runs them itself |
Create a custom token with exactly one permission row:
Account | Account Analytics | Read
Not Zone. A token carrying Zone Analytics Read authenticates fine and
answers zone queries happily, then fails every account query with
not authorized for that account. The RUM dataset is account-scoped only.
The plugin recognises that specific error and says so.
Nothing else is needed. In particular the plugin does not ask for
Account Settings Read: the obvious endpoint for listing your Web Analytics
sites (/accounts/{id}/rum/site_info/list) requires it, so the plugin finds
your sites through the analytics data instead.
Prefer an account-owned token over a user-owned one. A user token dies with that user's membership; an account-owned token does not.
pnpm add @eisbachcode/emdash-plugin-analytics// astro.config.mjs
import analytics from "@eisbachcode/emdash-plugin-analytics";
export default defineConfig({
integrations: [
emdash({
// database, storage, ...
plugins: [analytics],
}),
],
});To run it sandboxed, list it under sandboxed: [analytics] instead. That
needs a sandbox runner, which on Cloudflare means the Workers Paid plan; see
EmDash's plugin sandbox guide.
On Cloudflare, plan on Workers Paid either way. Installed under plugins,
the pages and the widget work on Workers Free, but the scheduled sync runs
under Free's 10 ms CPU limit per Cron Trigger and will most likely be cut
off. This has not been tested on Free.
Fill these in under Plugins → Analytics → Settings.
| Setting | Notes |
|---|---|
| Data source | Cloudflare Web Analytics, or demo data: generated numbers that need no account (see below) |
| Cloudflare API token | Stored encrypted (AES-GCM). Needs EMDASH_ENCRYPTION_KEY; without it saving fails rather than storing plaintext |
| Cloudflare account ID | Manage Account → Account Home |
| Web Analytics site tag | The site tag, not the beacon token. They are different values. In the Cloudflare dashboard it is the ID at the end of the site's Manage site link (…/web-analytics/edit/<site tag>); the analytics view does not show it. Leave empty and the widget lists the sites on the account that had traffic in the last 30 days, with their hostnames, so you can copy the right one |
| Hostnames to count | Comma-separated. Empty uses the site URL and its www form. One site tag often also covers *.pages.dev preview deploys, which should not be counted as production traffic |
| Sync every | 15 minutes by default |
| Keep daily rows for | 90 days by default |
| Paths per sync tick | 36 by default and at most: the most one tick can handle within a sandboxed invocation's ten subrequests. Lower it to write fewer D1 rows per day |
Set Data source to demo data and press Refresh on the dashboard widget. Refresh schedules a sync rather than running one, so the numbers appear after the next scheduled run: at once on Node, with the site's next Cron Trigger on Cloudflare. The plugin generates 90 days of plausible traffic, spread over your real entries plus two paths that are no entry, and runs it through the same sync, storage and path-to-entry join as real data. The widget says "Demo data, not real traffic" while it is on. Switching the data source back clears every stored number, so demo figures never mix with real ones.
Two different values on the same Cloudflare site:
- site tag — what the reporting API filters on. This plugin needs it.
- site token — what goes in the beacon snippet. The Astro integration below needs it.
Pasting the beacon token as the site tag returns no data at all, silently.
If your site already emits the Cloudflare beacon, skip this. That includes Cloudflare's automatic setup, which injects the beacon into Worker responses on a proxied custom domain too. If you set up the site with "exclude EU visitors", European visitors never get the beacon and your numbers will look close to zero. Either way, the plugin leaves /_emdash page views out of every number it reads, so automatic setup counting your admin sessions does not skew the figures.
// astro.config.mjs
import { analyticsBeacon } from "@eisbachcode/emdash-plugin-analytics/astro";

export default defineConfig({
  integrations: [
    analyticsBeacon({
      token: process.env.CF_WEB_ANALYTICS_TOKEN, // the site TOKEN
      productionFlagEnv: "IS_PRODUCTION",        // optional
    }),
  ],
});
It injects at Astro's head-inline stage, which costs zero database
queries. The plugin registers no page hook at all, so your logged-out
request count does not change.
Three things it does on purpose:
- Skips
/_emdash. The admin is an Astro page with its own<head>, so an injected beacon would count editor sessions and put/_emdash/…paths in your top pages. - Skips
astro dev. A dev server reports under the same site tag as production. PassincludeDev: trueif you want it. - Warns instead of no-op'ing when the token is missing, because a site that quietly collects nothing looks fine for weeks.
Consent gating, if you need it:
analyticsBeacon({
  token: "…",
  consent: { event: "emdash:consent:analytics", grantedFlag: "analyticsOk" },
});
The vendor script is appended only once the event fires. Cloudflare Web Analytics is cookieless and stores no identifiers, which several vendors treat as "no banner required" — under TDDDG §25 in Germany that is not a settled position. This integration gives you the gate; the decision is yours and this is not legal advice.
CSP, if your site sets one: script-src static.cloudflareinsights.com,
connect-src cloudflareinsights.com.
Cloudflare keeps unsampled beacon data for seven days. Beyond that it serves a roughly 10 % aggregate. Measured on a live account:
| Query start | Reported page views | Sample interval |
|---|---|---|
| 7 days back | 31 | 1.35 |
| 8 days back | 10 | 10 |
Past that boundary every value is a multiple of ten, and days too quiet to survive the sample vanish from the response entirely.
So this plugin never asks for a window starting more than seven days back, and never overwrites an exact stored row with an estimate. After the first week its own store holds numbers the Cloudflare dashboard can no longer reproduce. The consequence to know about: the first week after installing shows less history than you might expect, because there is no exact history to import. Anything the plugin does label as estimated says so in the widget.
Two more honest caveats:
- Today is always provisional. Even a single-day query for today comes back sampled, so today's row keeps moving and is labelled accordingly.
- Days are UTC. The API has no timezone concept; the Cloudflare dashboard renders in yours. Set the dashboard to UTC before comparing.
The widget and both pages declare plugins:read, which is editor and
above.
The editor panel declares content:edit_own, and EmDash also checks that
the user may edit that entry: authors see their own entries' numbers,
editors and admins every entry's, contributors none.
The MCP tools declare plugins:read like the pages, so an agent acting for
an author gets a permission error from all of them.
Authors and contributors will still see the widget card in the dashboard and get a permission error inside it — EmDash renders every declared widget for every role and gates on dispatch. That is an upstream gap, not something this plugin can fix.
The widget, both pages, the editor panel, toasts and error messages come in English and German, following the administrator's admin language. Any other admin language gets English. Number, date and country names follow the same language, so a German admin reads "1.234", "18.09.2026" and "Deutschland".
One limit comes from EmDash, not from this plugin: labels declared in the manifest stay English everywhere, that is the sidebar entry, the widget title and the settings form. EmDash renders those itself and does not read plugin translations.
Cloudflare's four rum* datasets are US-only. An EU metadata boundary
cannot hold them, and the default configuration excludes EU visitor data
unless you flip it. If a customer has written "EU storage" into their
requirements, this provider does not meet it — that is a reason to use a
different provider, not a plugin bug.
What leaves your site: path strings and a site tag, to
api.cloudflare.com. Nothing from your content.
One account-model caveat: the token is account-scoped and siteTag is just
a filter. If several client sites share one Cloudflare account, a token
given to one site's CMS can read every site's analytics in that account.
One account per site owner, or accept and document it.
- Referrers and countries beyond the last week. The plugin stores them per sync, not per day, so they cannot be summed over a longer range.
- A second provider. The
Providerinterface is in place for Plausible, which is also the answer for EU-storage requirements. - A Views column in the content list. EmDash lets only native admin code add one, which a sandboxed plugin cannot ship.
- Large sites catch up slowly. Every sync step fits EmDash's sandbox limit of ten calls, so the index walk, the daily 30-day sum and the per-path sync each handle a few dozen entries per tick.
MIT.