Repository navigation
[Feature Request] Local Usage Statistics Dashboard #947
Description

Local Usage Statistics Dashboard
Demo Video
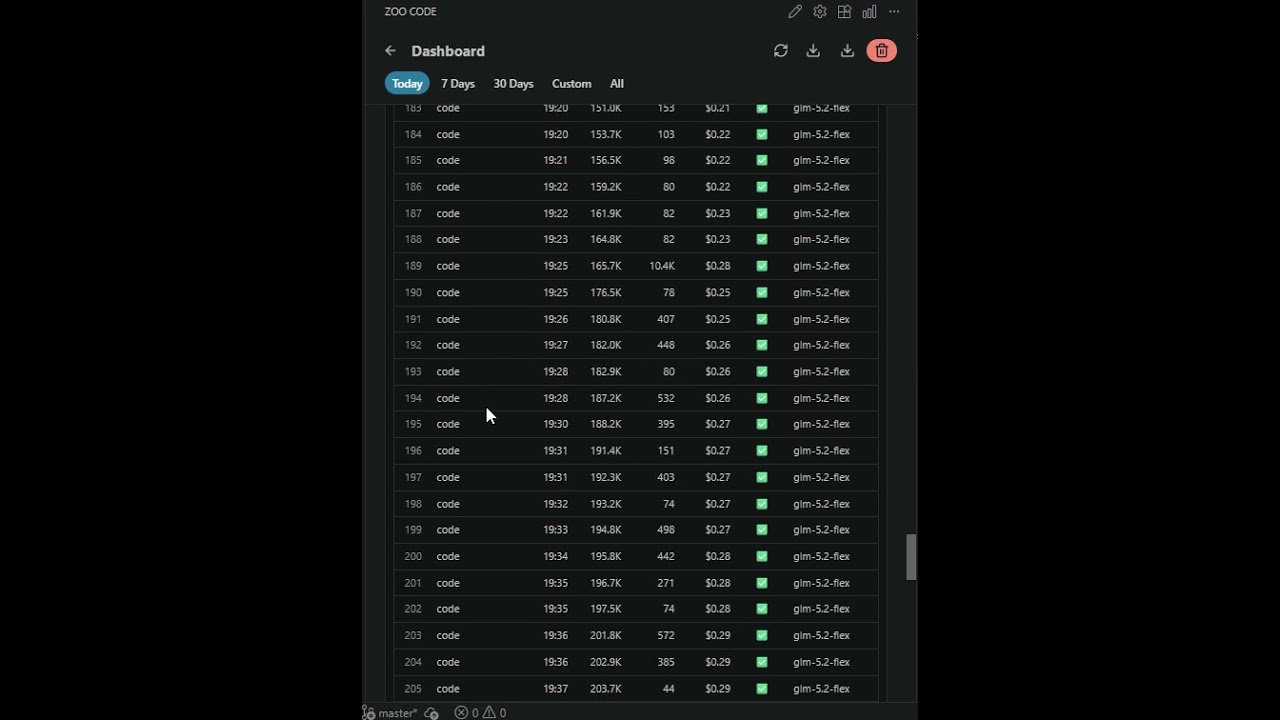
Overview
Originally proposed as a /stats slash command, this feature has been evolved into a full Dashboard accessible from the sidebar. The slash command approach was replaced with a richer, more discoverable Dashboard UI that provides comprehensive usage analytics for all LLM API calls.
What Changed: From /stats Command → Dashboard
| Aspect | Original (/stats) |
Final (Dashboard) |
|---|---|---|
| Access | Slash command in chat input | Sidebar icon (always accessible) |
| UI | Simple text-based stats panel | Full interactive dashboard with cards, charts, tables |
| Time ranges | Today / 7d / 30d / All | Today / 7 Days / 30 Days / Custom / All |
| Visualization | Text only | Summary cards + Daily Activity heatmap (30d/60d/120d/360d independent range) |
| Session tracking | ❌ Not included | ✅ Session list with titles, expandable API call details |
| Cost tracking | ❌ Not included | ✅ Per-call cost with provider-configured pricing, cost recalculation at query time |
| Model aggregation | Basic | Multi-model session support with per-model/provider/mode breakdown |
| Filters | None | Model filter + Provider filter on session list |
| Grouping | Model, Provider, Mode | Model, Provider, Mode (with detailed breakdown table) |
| Export | JSON / CSV | JSON / CSV (unchanged) |
| i18n | English only | 18 languages (en, ko, ja, de, es, fr, it, ca, hi, id, nl, pl, pt-BR, ru, tr, vi, zh-CN, zh-TW) |
Dashboard Features
📊 Summary Cards
- Total tokens, total cost, event counts (completed/failed/cancelled)
- Input, Output, Cache Read, Cache Write, Reasoning tokens breakdown
🗓️ Daily Activity Heatmap
- GitHub-style contribution heatmap with 6 intensity levels (blue gradient)
- Independent time range selector: 30d / 60d / 120d / 360d
- Works independently from the top-level date picker
- Hover tooltips showing date, token count, and event count
📋 Breakdown Table
- Group by Model, Provider, or Mode
- Shows: Events, Input/Output/Cache tokens, Reasoning, Total tokens, Cost
📑 Session List
- Each unique
taskIdappears as a session with a title (first user message, truncated) - Expandable accordion: click to see individual API call details
- Filter by Model and/or Provider
- Session detail shows each API call with model, provider, tokens, cost, status, duration
💰 Cost Tracking
- Per-call cost calculated from provider-configured pricing
costRecalculationengine fills in missing costs at query time- Supports all 30+ providers (OpenAI, Anthropic, Bedrock, DeepSeek, Mistral, Moonshot, XAI, Poe, Kenari, etc.)
⚙️ Actions
- Refresh: Re-fetch current data
- Export: Download as JSON or CSV
- Clear: Reset all statistics with nonce-based confirmation dialog
🌐 Internationalization
Full translations for 18 languages including Korean, Japanese, German, Spanish, French, Italian, Catalan, Hindi, Indonesian, Dutch, Polish, Portuguese (Brazil), Russian, Turkish, Vietnamese, Simplified Chinese, and Traditional Chinese.
Technical Architecture
Data Flow
API Call Complete → UsageRecorder (Task.ts finalize)
  → UsageEventStore (append-only NDJSON)
  → UsageStatsService (query/aggregation/export)
  → usageStatsMessageHandler (IPC)
  → DashboardView (webview)
Storage
- Location: VS Code
globalStorage/usage-stats/ - Format: Append-only NDJSON event log
- Safety: No API keys, prompts, or response bodies stored
- Recovery: Corrupt data quarantined, never deleted
Key Components
UsageEventStore— Append-only local event storageUsageAggregator— Bucket-based aggregation engineUsageStatsService— Query, export, and clear operationscostRecalculation— Fills missing costs at query timeusageStatsMessageHandler— Webview ↔ Extension IPC handlerDashboardView— Main dashboard UI with all sub-componentsUsageHeatmap— Self-fetching daily activity heatmapSessionList/SessionDetail— Session browsing with API call details
Related PR
- PR feat(dashboard): add local usage statistics dashboard with session detail #948:
feat(dashboard): add local usage statistics dashboard with session detail
📝 Original Issue Description (archived)
Summary
Add a /stats slash command that displays local token usage statistics for LLM API calls, similar to Claude Code's /stats feature.
Problem
Users have no way to track their actual token consumption across different models, providers, and sessions. Current UI shows per-task token counts but doesn't provide aggregate statistics over time.
Proposed Solution
A /stats command that opens a dedicated statistics panel showing:
Core Features
- Time ranges: Today, 7 days, 30 days, All time
- Token breakdown: Input, Output, Cache Read, Cache Write, Reasoning tokens
- Grouping: By model, provider, Zoo Code mode, status (completed/failed/cancelled)
- Time-axis aggregation: Daily, weekly, monthly views
- Daily heatmap: Visual representation of usage over time
- Export: JSON and CSV formats
- Reset: With confirmation dialog
Technical Design
- Append-only event log: Each API call records a
UsageEventas NDJSON - Local storage only: Data stored in
globalStorage/usage-stats/ - No sensitive data: API keys, prompts, and responses are never stored
- Single instrumentation point:
Task.tsterminal finalize (not per-chunk) - Idempotent recording: Prevents duplicate events from retries
Safety
- Data is local-only (VS Code globalStorage)
- API keys, prompts, responses are never stored
- Storage failures don't affect LLM task execution
- Corrupt data is quarantined, not deleted
- Clear requires nonce-based confirmation
Alternatives Considered
- Mutable cumulative summary — Simpler but no audit trail, can't reaggregate
- Scan existing task history on demand — Slow, incomplete data, privacy concerns
Additional Context
- Implementation follows the existing Zoo Code architecture patterns
- No new runtime dependencies (uses existing Zod, proper-lockfile, safeWriteJson)
- Compatible with all 30+ providers through the common
ApiStreamUsageChunktype
Activity
[-][Feature Request] `/stats` Local Usage Statistics Command[/-][+][Feature Request] Local Usage Statistics Dashboard[/+]