Skip to content

build: support VictoriaLogs v1.49.0 and every v1.5x release - #770

Open
szibis wants to merge 7 commits into
mainfrom
build/victorialogs-floor-1.49-min
Open

szibis wants to merge 7 commits into
mainfrom
build/victorialogs-floor-1.49-min

Conversation

@szibis

@szibis szibis commented Oct 18, 2026

Copy link
Copy Markdown
Collaborator

Summary

Supported VictoriaLogs is now v1.49.0 (the latest v1.4x release) and every v1.5x release. The startup floor -backend-min-version moves from v1.40.0 to v1.49.0, the CI matrix tests every supported minor, and the version gates that only served releases before v1.49 are removed.

VictoriaLogs Version
Supported v1.49.0 and every v1.5x release
Tested in CI v1.49.0, v1.50.0, v1.51.1, v1.52.0, v1.53.0 (every supported minor at its latest patch with a published image; v1.52.1 has none)
Pull-request CI pin v1.52.0 (unchanged)
Startup floor v1.49.0 (was v1.40.0)

Why. The v1.40–v1.46 band was supported only through capability gates and never ran in CI. On VictoriaLogs v1.40.0 the e2e range-metric table fails 65 subtests against Loki, on main as on any branch, every one a series missing one sample at a window edge (proxy has 3 samples, Loki 4): stats_query_range ignores the offset argument before v1.45. On v1.49.0 and v1.50.0 the same table passes on main (789 passed, 0 failed, the 3 known open skips).

Changes

  • Floor: flag default and help text, the Go fallback for an empty value, the Helm value (live and example), logsql.MinSupportedMinor 49, the support_window and matrix_versions of compatibility-matrix.json, the regenerated configuration reference. Older backends stop at startup with an error naming -backend-allow-unsupported-version. That flag, or an explicit older -backend-min-version (the comparison with the configured minimum is unchanged), still starts the proxy; a version below v1.49.0 is then logged as unsupported and untested on every start whatever the configured minimum (TestBackendVersionBelowSupportedLinesWarns).
  • Removed gates (each introduced at or before v1.49):
    • stats_query_range offset (v1.45): always sent. The epoch-aligned-only tumbling and sliding grids, the raw-row route for unaligned starts and the gate of the name_extracted pushdown are gone. Raw evaluation stays where it does not depend on the version (buckets below 1 ms, byte and row limits).
    • Metadata filter=substring (v1.49): always forwarded with q; the proxy-side search window stays (it also serves the browse index and paging).
    • logsql.Capabilities StatsRateSum (v1.44, no consumer), FieldIPv4Range (v1.45) and MetadataSubstring (v1.49): ip() always uses ipv4_range() for IPv4, the regular expression stays for IPv6 and unparsable input.
    • v1.50+ behaviour (dense pattern windowing, column-index field_values, the v1.51 coalesce pipe, the v1.52 parse-error echo) keeps its fallback down to v1.49.0. Capability profile names are unchanged.
  • Unknown version (startup probe pending or /metrics not routed) behaves as v1.49.0. The background /metrics re-probe (every 5 minutes while unknown) is triggered from the version-header observer, since the function that triggered it is removed.
  • Weekly matrix (compat-vl.yaml): each version also runs the range-metric table against Loki (TestCompat_Unwrap.*, TestRangeMetric.*, TestGrafanaClickout_.*), with an explicit test (25 min) and job (40 min) timeout.
  • TestVictoriaLogsSupportPolicy enforces the rule: floor = lowest matrix version = flag default = Go fallback = Helm value = MinSupportedMinor; exactly one v1.4x entry (the floor); every v1.5x minor from v1.50 up once; the pin is a tested version; the README table lists the same versions.
  • README gets a "Supported versions" section; the VictoriaLogs compatibility page, compatibility matrix, testing, configuration, LogsQL architecture, Drilldown and real-window docs drop the statements this change makes false. Registry: the three capability rows of the removed fields, the test names the change renames, and the versions/stats-bucket-label-v1.45 case (pre-v1.45 behaviour is now outside the supported versions).

Nothing else changes: probe, profile names, error wording and unrelated tests are untouched.

Proofs

CI version matrix on this branch (workflow_dispatch, head b7113d7f): v1.49.0, v1.50.0, v1.51.1, v1.52.0 and v1.53.0 pass with the range-metric table (v1.49.0: 819 passed, 0 failed, 3 skipped), about 6.5 minutes per version; the pinned v1.52.0 job passes.

e2e vs Loki 3.7.7, fresh isolated stack per run, compared with main (f5c05e3a) by test name, VictoriaLogs restarts 0 → 0:

VictoriaLogs group branch main difference
v1.52.0 core 1541 passed / 0 failed / 3 skipped 1541 / 0 / 3 none
v1.52.0 semantics 897 / 0 / 3 897 / 0 / 3 none
v1.49.0 range-metric table 789 / 0 / 3 789 / 0 / 3 none
v1.49.0 core 1541 / 0 / 3 1541 / 0 / 3 none

TestProxyCompatibilitySurface/vmauth_proxy_drilldown_limits_backend_detection passes on both builds and both versions.

Startup floor against VictoriaLogs v1.48.0: with default flags the proxy exits 1 with detected backend version v1.48.0-0-g3b50299862 ... is below minimum supported v1.49.0; compatibility may be incomplete. Set -backend-allow-unsupported-version=true to bypass at your own risk; with -backend-allow-unsupported-version=true it starts and warns that the version is unsupported and untested. On v1.49.0 it starts with minimum_supported_version v1.49.0.

A/B (bench/ab/pr_smoke.py, VictoriaLogs v1.52.0 at 2 CPUs, main vs branch, 18 sets selected for the changed files):

run rows verdicts p50 sum (main → branch) new differences
1h with Loki 147 147 same (control 20/20) 6.79 s → 7.04 s 0 (27 differences from Loki, identical on main)
6h / 24h / 7d 211 211 same 196.4 s → 194.3 s 0

Four cells the first long pass flagged measured the same when run again. Exact answers of binary, offset, sliding and tumbling queries compared directly: identical except last-digit float rounding (relative difference ≤ 4e-16) that two instances of the main binary show against each other too.

benchstat (10 interleaved rounds, GOMAXPROCS=4): proxy hot paths geomean +0.43% time, +0.20% bytes, −0.05% allocations; translator +3.5% time (noise; spread up to ±80%). One deterministic change: Translate_IPFilterFallback, which uses a version below the floor, now builds ipv4_range() (+2 allocations), the path v1.45+ already took.

Grafana range matrix (Grafana 13.2.3, 43 pages at 5m, 15m, 1h, 6h, 24h and 7d plus Live tail, 260 rows, main vs branch vs Loki): main and branch identical on 259 rows. The 260th, the 7d dd-fields breakdown (256,595 frames of span_id/trace_id), killed Grafana while loading, so one chunk was captured on one side only; every request captured on both sides has the same status, frames and hash. Against Loki: no new difference, the same 117 differences from Loki on both builds.

Load (8 clients, 240 s, 78 shapes at 24h and 7d, fresh proxy per build):

main branch
requests 180 167
status 159×200, 4×429, 11×502, 6×400 147×200, 4×429, 11×502, 5×400
p50 / p95 / p99 10.5 / 29.7 / 32.8 s 11.7 / 28.5 / 31.9 s
/labels 210 of 210 answered 200, p50 2 ms 211 of 211 answered 200, p50 2 ms
proxy RSS peak 2,680 MB 2,537 MB
VictoriaLogs restarts 0 → 0 0 → 0

The failing shapes are the same on both builds (the heavy-query admission limit, the 502s of the 7d drilldown and rate_counter shapes, Loki's own 400 for json rate by level).

Unit and gates: capped full run (GOMEMLIMIT=3GiB GOMAXPROCS=4 go test -short -p 1 ./..., peak RSS 1.32 GB against 1.43 GB on main), -race on the touched tests, go vet with every build tag, gofmt, golangci-lint, the conformance, matrix-link and changelog gates, the CI script and bench unit suites, and TestPinnedCompatibilityMatrixMatchesCompose pass. Dropping unwrap_rate from the window functions fails the raw-evaluator tests this change keeps covering that path.

Supported VictoriaLogs is v1.49.0 (the latest v1.4x release) plus every
v1.5x release. The -backend-min-version default, its Go fallback, the Helm
value and logsql.MinSupportedMinor move to v1.49.0, the manifest support
window and tested matrix become v1.49.0, v1.50.0, v1.51.1, v1.52.0 and
v1.53.0, and the README names the supported and tested versions.

logsql.Capabilities drops the flags for features at or before the floor
(rate_sum, ipv4_range, metadata substring): the zero value is the floor,
which is also what an unknown backend version gets. BestIPv4Range emits
ipv4_range() for IPv4 unconditionally.
The weekly matrix job ran the compatibility score and three version-sensitive
checks. The range-metric table compared with Loki (unwrap, range metric
compatibility, Grafana click-outs) is what broke on older backends, so it now
runs on every supported VictoriaLogs version too, with an explicit test and job
timeout.
… gates

The supported floor is v1.49.0, so the gates and fallbacks that only served
older backends are removed:

- stats_query_range offset (v1.45): buckets are always anchored with the
  offset arg; the epoch-aligned-only tumbling and sliding grids, the raw-row
  route for unaligned grids and the ordered-JSON pushdown gate are gone.
  Raw evaluators that do not depend on the version (sub-millisecond buckets,
  byte and row limits, more than 11,000 buckets) stay.
- metadata substring filter (v1.49): q and filter=substring are always
  forwarded. The proxy-side search window stays, it also serves the label
  values browse index and offset/limit windowing.

An unknown backend version behaves as the floor, and the background /metrics
probe that supportsStatsRangeOffset used to trigger now runs from any upstream
response without a version while it is unknown. Tests that only exercised the
removed fallbacks are rewritten to assert anchored buckets on v1.49.0, v1.52.0
and an unknown version; the raw-sample evaluator coverage of the unwrap rate
window is kept by forcing that route without a version gate.
The generated matrix link and wiring are refreshed for the new matrix, the
capability rows of the removed gates (rate_sum, ipv4_range, metadata
substring) are deleted, and the two cases that cite the rewritten ordered JSON
pushdown test use its new name.
The compatibility, matrix, testing, configuration and architecture pages
state the new rule (the latest v1.4x release plus every v1.5x release), the
version table starts at v1.49.0 and adds v1.50.0, and the sentences that
described the stats offset, metadata substring and ipv4_range fallbacks are
removed.
… the v1.49.0 floor

The pre-v1.45 stats bucket case no longer describes version gates that were
removed: it records the unsupported-version behaviour as a kept difference of
the support floor. The ordered JSON pushdown case no longer says it is gated
off below v1.45, the VictoriaLogs edge-case bands in the manifest list only
the supported v1.49 line, and the testing guide's example image is a
supported version.
@github-actions github-actions Bot added size/XL Extra large change scope/translator LogQL translator scope/proxy Proxy core scope/helm Helm chart scope/ci CI/CD scope/docs Documentation scope/cli CLI flags scope/tests Tests labels Oct 18, 2026
@github-actions

Copy link
Copy Markdown
Contributor

PR Quality Report

Compared against base branch main.

Coverage and tests

Signal Base PR Delta
Test count 11242 11255 13
Coverage 88.3% 88.3% 0.0% (stable)

Compatibility

Track Base PR Delta
Loki API 100.0% 11/11 (100.0%) 0.0% (stable)
Logs Drilldown 100.0% 17/17 (100.0%) 0.0% (stable)
VictoriaLogs 100.0% 11/11 (100.0%) 0.0% (stable)

Performance smoke

Lower CPU cost (ns/op) is better. Lower benchmark memory cost (B/op, allocs/op) is better. Higher throughput is better. Lower load-test memory growth is better. Benchmark rows are medians from repeated samples.

Signal Base PR Delta
QueryRange cache-hit CPU cost 1948.0 ns/op 2027.0 ns/op +4.1% (stable)
QueryRange cache-hit memory 1240.0 B/op 1240.0 B/op 0.0% (stable)
QueryRange cache-hit allocations 27.0 allocs/op 27.0 allocs/op 0.0% (stable)
QueryRange cache-bypass CPU cost 2272.0 ns/op 2225.0 ns/op -2.1% (stable)
QueryRange cache-bypass memory 1281.0 B/op 1279.0 B/op -0.2% (stable)
QueryRange cache-bypass allocations 27.0 allocs/op 27.0 allocs/op 0.0% (stable)
Labels cache-hit CPU cost 579.3 ns/op 580.2 ns/op +0.2% (stable)
Labels cache-hit memory 48.0 B/op 48.0 B/op 0.0% (stable)
Labels cache-hit allocations 3.0 allocs/op 3.0 allocs/op 0.0% (stable)
Labels cache-bypass CPU cost 911.6 ns/op 903.2 ns/op -0.9% (stable)
Labels cache-bypass memory 396.0 B/op 396.0 B/op 0.0% (stable)
Labels cache-bypass allocations 14.0 allocs/op 14.0 allocs/op 0.0% (stable)

State

  • Coverage, compatibility, and sampled performance are reported here from the same PR workflow.
  • This is a delta report, not a release gate by itself. Required checks still decide merge safety.
  • Performance is a smoke comparison, not a full benchmark lab run.
  • Delta states use the same noise guards as the quality gate (percent + absolute + low-baseline checks), so report labels match merge-gate behavior.

@github-actions

Copy link
Copy Markdown
Contributor

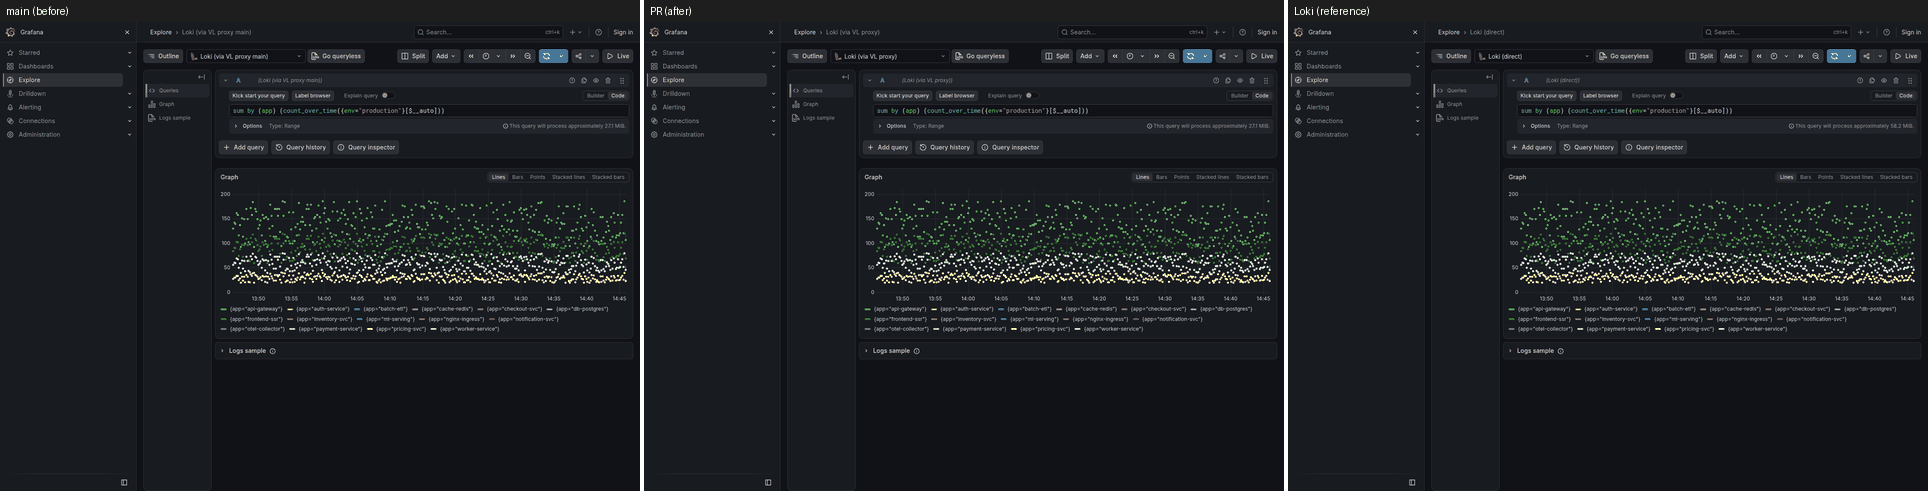
✅ Visual smoke: passed

Base f5c05e3ad7 vs PR b7113d7f4a, Grafana through the proxy builds and Loki on one fresh stack; run.
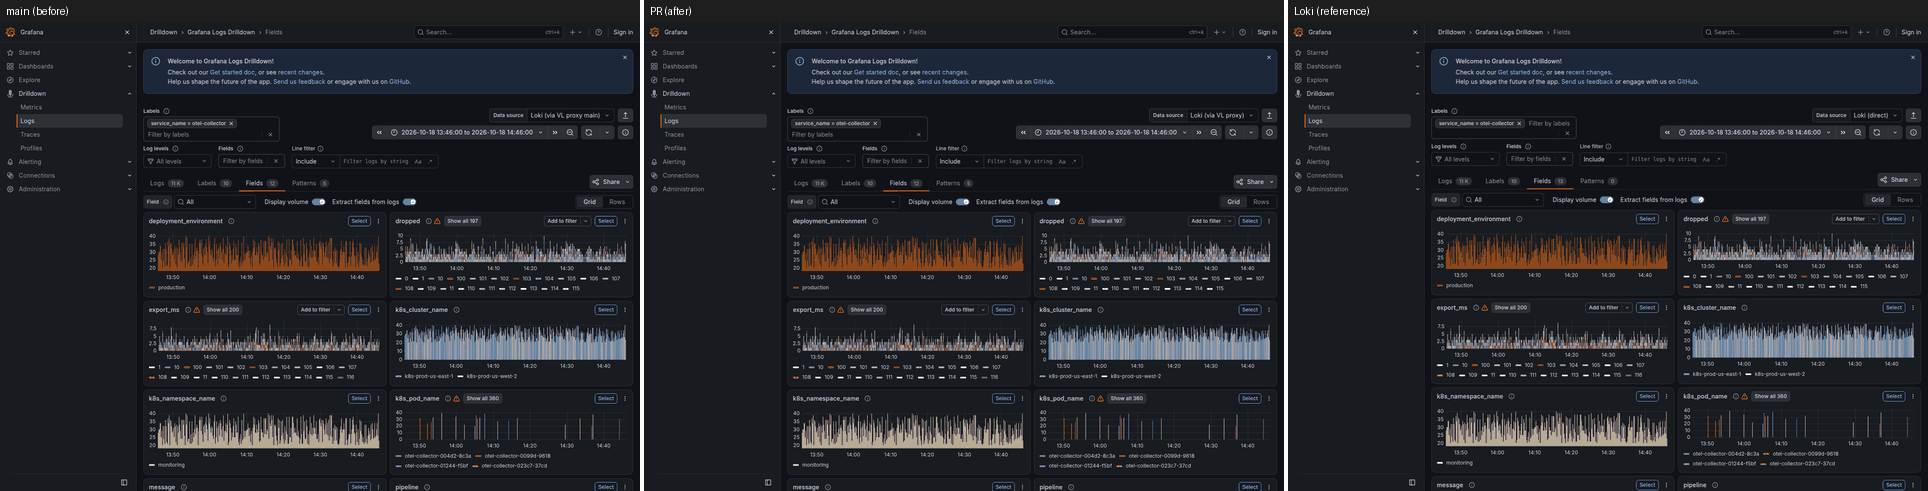
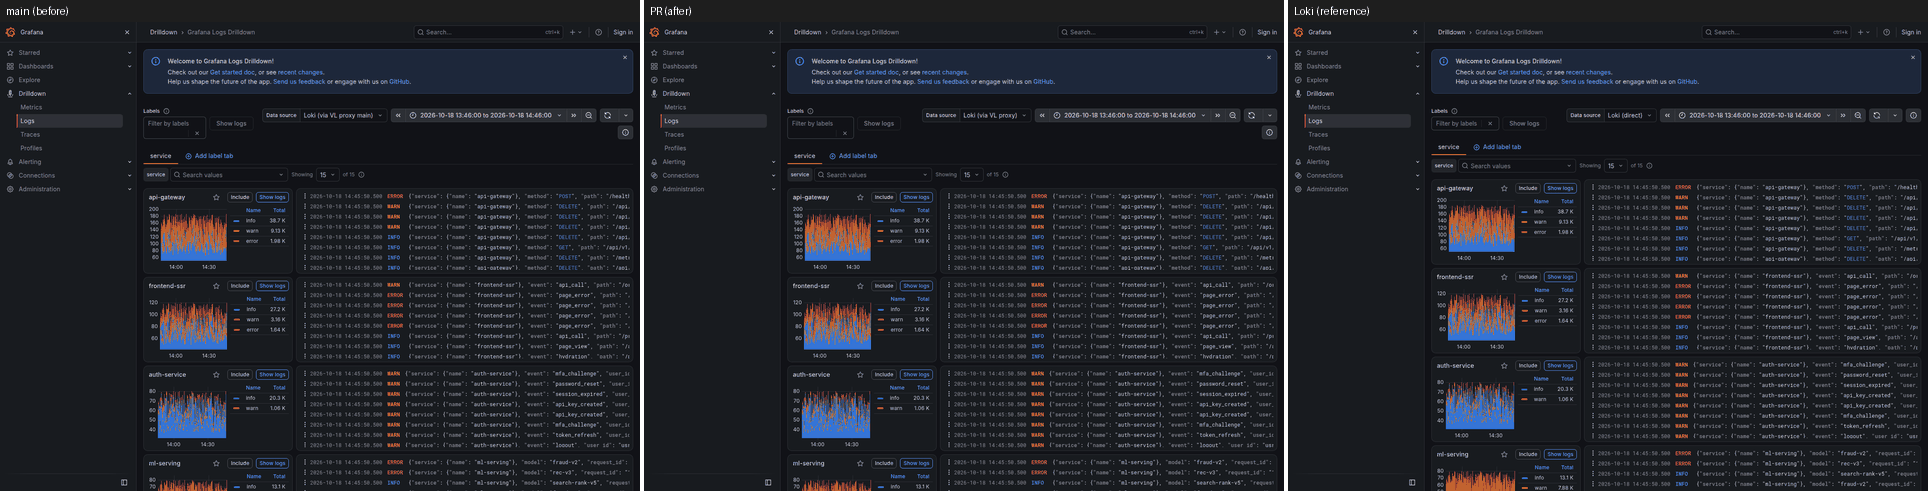
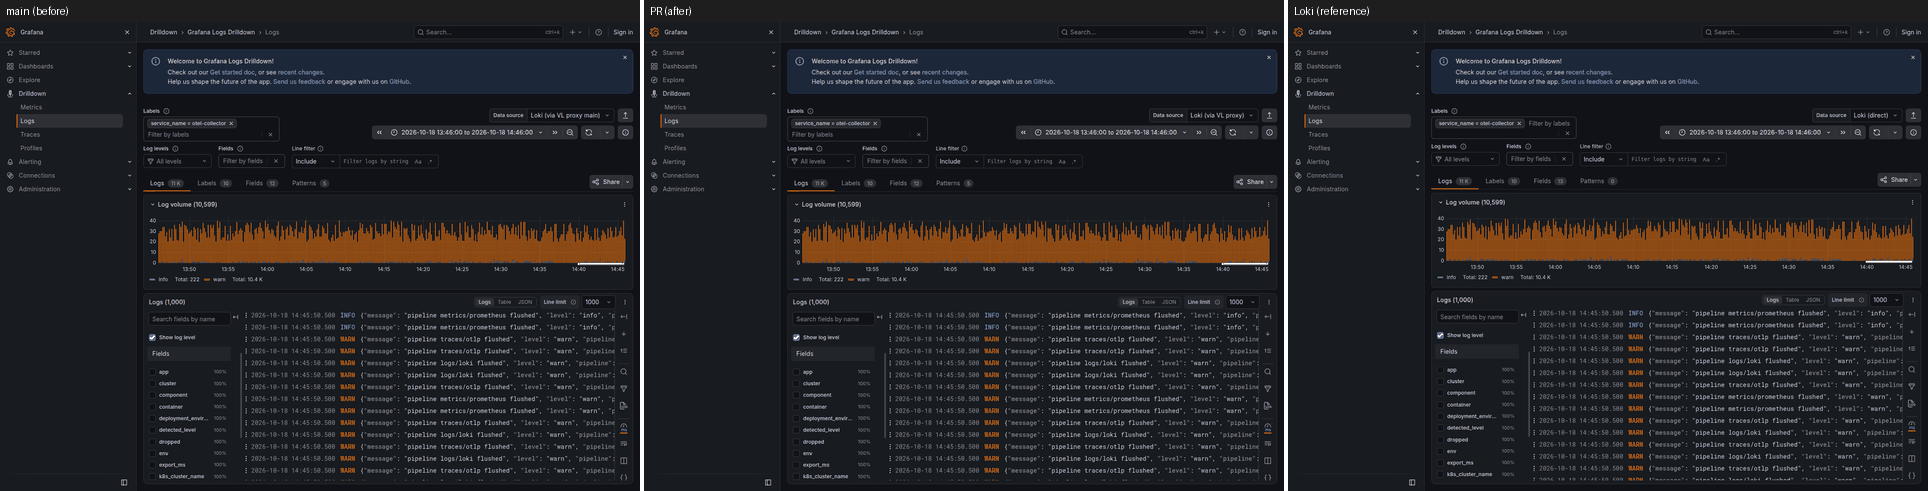
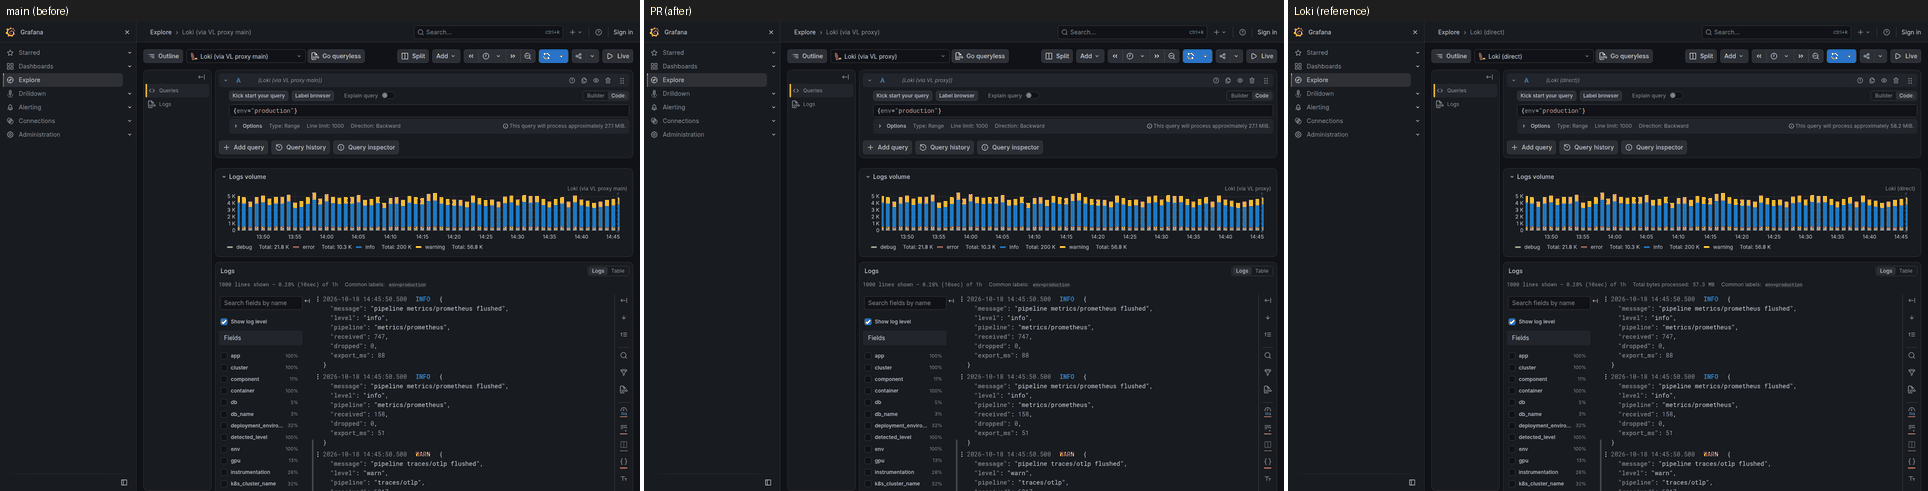
Core set: 5 capture(s) at 1h. Detailed set: 31 entries (explore-metric-plain, explore-A, explore-B, explore-C, explore-E, explore-F, explore-logs-json, explore-logfmt-metric, ...). 37 capture(s), 15m/1h/6h, 24h and 7d stay out of PR runs.
Trimmed to the 1h range for the capture budget: explore-A, explore-B, explore-C, explore-E, explore-F, explore-logs-json, explore-logfmt-metric, explore-logs-extracted, explore-extracted-metric, explore-extracted-filter-metric, explore-extracted-group-metric, explore-logs-plain-level, explore-plain-level-metric, explore-metric-parenthesized, explore-logs-line-filter-or, explore-metric-line-filter-or, explore-unwrap-sum, explore-unwrap-unit-string, explore-unwrap-missing-label, explore-unwrap-conversion-error, explore-unwrap-rate-sum, explore-empty-pattern-filter, explore-unwrap-duration-seconds, explore-pattern-filter-anchored, explore-label-browser, explore-log-context, dd-labels, dd-labels-namespace, dd-field-service_version, dd-field-pipeline, explore-sum-without-rate, explore-topk-sum-without, explore-sum-without-count.
Not run (capture budget): explore-sum-without-count, explore-topk-sum-without, explore-sum-without-rate, dd-field-pipeline.

page range set base = PR (data) vs Loki (PR) pixel diff result
dd-fields 1h core ✅ identical identical (4 explained, 1 history-dependent) 0.12% ✅
dd-landing 1h core ✅ identical identical (3 explained) 0.14% ✅
dd-service-logs 1h core ✅ identical identical (3 explained, 1 history-dependent) 0.12% ✅
explore-logs-plain 1h core ✅ identical identical (1 explained) 0.07% ✅
explore-metric-plain 1h core ✅ identical identical (1 explained) 0.04% ✅
dd-field-service_version 1h detailed ✅ identical identical (3 explained, 1 history-dependent) 0.12% ✅
dd-labels 1h detailed ✅ identical identical (3 explained, 1 history-dependent) 0.12% ✅
dd-labels-namespace 1h detailed ✅ identical identical (3 explained, 1 history-dependent) 0.12% ✅
explore-A 1h detailed ✅ identical identical (1 explained) 0.04% ✅
explore-B 1h detailed ✅ identical identical (1 explained) 0.04% ✅
explore-C 1h detailed ✅ identical identical (1 explained) 0.04% ✅
explore-E 1h detailed ✅ identical identical (1 explained) 0.04% ✅
explore-F 1h detailed ✅ identical identical (1 explained) 0.04% ✅
explore-empty-pattern-filter 1h detailed ✅ identical identical (1 explained) 0.07% ✅
explore-extracted-filter-metric 1h detailed ✅ identical identical (1 explained) 0.04% ✅
explore-extracted-group-metric 1h detailed ✅ identical identical (1 explained) 0.04% ✅
explore-extracted-metric 1h detailed ✅ identical identical (1 explained) 0.04% ✅
explore-label-browser 1h detailed ✅ identical identical 0.02% ✅
explore-log-context 1h detailed ✅ identical identical (1 explained) 0.04% ✅
explore-logfmt-metric 1h detailed ✅ identical identical (1 explained) 0.04% ✅
explore-logs-extracted 1h detailed ✅ identical identical (1 explained) 0.07% ✅
explore-logs-json 1h detailed ✅ identical identical (1 explained) 0.07% ✅
explore-logs-line-filter-or 1h detailed ✅ identical identical (1 explained) 0.07% ✅
explore-logs-plain-level 1h detailed ✅ identical identical (2 explained) 0.07% ✅
explore-metric-line-filter-or 1h detailed ✅ identical identical (1 explained) 0.04% ✅
explore-metric-parenthesized 1h detailed ✅ identical identical (1 explained) 0.04% ✅
explore-metric-plain 15m detailed ✅ identical identical (1 explained) 0.04% ✅
explore-metric-plain 6h detailed ✅ identical n/a (beyond the Loki window) 0.04% ✅
explore-pattern-filter-anchored 1h detailed ✅ identical identical (1 explained) 0.07% ✅
explore-plain-level-metric 1h detailed ✅ identical identical (1 explained) 0.04% ✅
explore-unwrap-conversion-error 1h detailed ✅ identical identical (1 explained) 0.04% ✅
explore-unwrap-duration-seconds 1h detailed ✅ identical identical (1 explained) 0.04% ✅
explore-unwrap-missing-label 1h detailed ✅ identical identical (1 explained) 0.04% ✅
explore-unwrap-rate-sum 1h detailed ✅ identical identical (1 explained) 0.04% ✅
explore-unwrap-sum 1h detailed ✅ identical 1 difference(s), 1 on base too; 1 explained 0.04% ✅
explore-unwrap-unit-string 1h detailed ✅ identical identical (1 explained) 0.04% ✅
tail-json-filter live detailed ✅ identical entries in the window: PR 1903, Loki 606, in both 606 5.93% ✅

Gate: a base-vs-PR data difference passes when the PR is closer to Loki, and fails when the PR diverges from Loki or Loki cannot decide it (at a range Loki does not hold, a difference passes when the same page proved it closer to Loki at a shorter range; otherwise label the pull request visual-change-expected to accept an intended change). Also failing: a panel empty on the PR but not on the base, an error banner, panel error, error answer or new "No data" panel on the PR, a PR side that never settled, a difference that did not reproduce on the recapture. Pixel differences only warn.

Core set montages (5): base | PR | Loki

dd-fields-1h

dd-fields-1h

dd-landing-1h

dd-landing-1h

dd-service-logs-1h

dd-service-logs-1h

explore-logs-plain-1h

explore-logs-plain-1h

explore-metric-plain-1h

explore-metric-plain-1h

All montages of this run: pr-visuals/pr-770.

@github-actions

Copy link
Copy Markdown
Contributor

⚪ Performance A/B: no change beyond noise

147 shape×range — 147 ⚪ same · results vs Loki: 120 same, 0 new difference(s), 27 pre-existing

Every shape is within noise of the base build (±30% and 100 ms).

147 unchanged shape×range (within noise)
shape range base p50 PR p50 change Loki p50 PR ÷ Loki result vs Loki
⚪ by service_name 1h 37 ms 39 ms ⚪ +5% 40 ms 0.97× ✅ same
⚪ bytes_over_time by app 1h 73 ms 70 ms ⚪ -4% 88 ms 0.80× ✅ same
⚪ detected_level volume 1h 92 ms 88 ms ⚪ -4% 39 ms 2.26× ✅ same
⚪ drilldown detected_level 1h 73 ms 75 ms ⚪ +3% 24 ms 3.12× ✅ same
⚪ drilldown level volume 1h 13 ms 14 ms ⚪ +8% 24 ms 0.58× ✅ same
⚪ drilldown service landing 1h 31 ms 33 ms ⚪ +6% 25 ms 1.32× ✅ same
⚪ instant json filtered instant 380 ms 375 ms ⚪ -1% 73 ms 5.14× ✅ same
⚪ instant json volume instant 448 ms 453 ms ⚪ +1% 96 ms 4.72× ✅ same
⚪ instant ungrouped rate instant 9 ms 6 ms ⚪ -33% 69 ms 0.09× ✅ same
⚪ json rate by level (no filter, no drop) 1h 400 400 ⚪ +0% 400 — ✅ same
⚪ json volume no filters 1h 202 ms 199 ms ⚪ -1% 3 ms 66× ✅ same
⚪ logfmt count by level, filter, drop 1h 449 ms 456 ms ⚪ +2% 55 ms 8.29× ✅ same
⚪ logfmt volume 1h 306 ms 306 ms ⚪ +0% 62 ms 4.94× ✅ same
⚪ logs plain 1h 83 ms 74 ms ⚪ -11% 47 ms 1.57× ✅ same
⚪ logs | json 1h 111 ms 112 ms ⚪ +1% 69 ms 1.62× ✅ same
⚪ logs | logfmt 1h 170 ms 173 ms ⚪ +2% 54 ms 3.20× ✅ same
⚪ plain volume 1h 19 ms 19 ms ⚪ +0% 37 ms 0.51× ✅ same
⚪ stream-label count by app 1h 26 ms 29 ms ⚪ +12% 38 ms 0.76× ✅ same
⚪ topk rate by app 1h 45 ms 47 ms ⚪ +4% 86 ms 0.55× ➖ differs (as base)
⚪ ungrouped rate 1h 13 ms 11 ms ⚪ -15% 82 ms 0.13× ✅ same
⚪ DB1 label breakdown pod 1h 82 ms 85 ms ⚪ +4% 110 ms 0.77× ✅ same
⚪ DB2 label breakdown namespace 1h 20 ms 15 ms ⚪ -25% 37 ms 0.41× ✅ same
⚪ DB3 json field breakdown user_id 1h 50 ms 47 ms ⚪ -6% 25 ms 1.88× ✅ same
⚪ DB4 json field breakdown batch_id 1h 100 ms 95 ms ⚪ -5% 51 ms 1.86× ✅ same
⚪ X1 json filter level_extracted, by level 1h 367 ms 368 ms ⚪ +0% 41 ms 8.98× ✅ same
⚪ X2 json group by level_extracted 1h 304 ms 304 ms ⚪ +0% 45 ms 6.76× ✅ same
⚪ X3 json rate, level_extracted equality 1h 274 ms 272 ms ⚪ -1% 34 ms 8.00× ✅ same
⚪ X4 json bytes, level_extracted regexp 1h 384 ms 386 ms ⚪ +1% 91 ms 4.24× ✅ same
⚪ X5 logfmt filter level_extracted, by level 1h 677 ms 660 ms ⚪ -3% 52 ms 13× ✅ same
⚪ E1 logs, json parser over stream labels 1h 116 ms 112 ms ⚪ -3% 68 ms 1.65× ✅ same
⚪ E2 logs, logfmt parser over stream labels 1h 79 ms 79 ms ⚪ +0% 54 ms 1.46× ✅ same
⚪ E3 logs, json, existence filter on level_extracted 1h 148 ms 144 ms ⚪ -3% 79 ms 1.82× ✅ same
⚪ E4 logs, logfmt, existence filter on level_extracted 1h 93 ms 88 ms ⚪ -5% 61 ms 1.44× ✅ same
⚪ E5 logs, json, drop level_extracted 1h 117 ms 116 ms ⚪ -1% 63 ms 1.84× ✅ same
⚪ E6 logfmt count by level_extracted 1h 45 ms 45 ms ⚪ +0% 7 ms 6.43× ✅ same
⚪ E7 json count by level_extracted 1h 143 ms 144 ms ⚪ +1% 15 ms 9.60× ✅ same
⚪ E8 instant logfmt by level_extracted instant 8 ms 8 ms ⚪ +0% 10 ms 0.80× ✅ same
⚪ A explore volume, 2 filters, drop 1h 155 ms 153 ms ⚪ -1% 40 ms 3.82× ✅ same
⚪ B grouped sum, filter, no drop 1h 106 ms 106 ms ⚪ +0% 40 ms 2.65× ✅ same
⚪ C ungrouped sum, filter, no drop 1h 107 ms 104 ms ⚪ -3% 39 ms 2.67× ✅ same
⚪ D volume, no filters 1h 232 ms 227 ms ⚪ -2% 50 ms 4.54× ✅ same
⚪ E field breakdown pipeline (explore) 1h 103 ms 105 ms ⚪ +2% 39 ms 2.69× ✅ same
⚪ F field breakdown service_version (explore) 1h 153 ms 167 ms ⚪ +9% 43 ms 3.88× ✅ same
⚪ G field breakdown pipeline (drilldown) 1h 43 ms 50 ms ⚪ +16% 24 ms 2.08× ✅ same
⚪ H field breakdown service_version (drilldown) 1h 91 ms 99 ms ⚪ +9% 26 ms 3.81× ✅ same
⚪ I grafana volume of B 1h 106 ms 101 ms ⚪ -5% 35 ms 2.89× ✅ same
⚪ O2 explore log volume (Grafana form), underscore structured-metadata filter 1h 68 ms 69 ms ⚪ +1% 35 ms 1.97× ✅ same
⚪ label values env ending now 1h 3 ms 3 ms ⚪ +0% 10 ms 0.30× ✅ same
⚪ label values env ending two days ago (control) 1h 3 ms 2 ms ⚪ -33% 2 ms 1.00× ➖ differs (as base)
⚪ labels ending now 1h 2 ms 2 ms ⚪ +0% 3 ms 0.67× ✅ same
⚪ labels ending two days ago (control) 1h 2 ms 2 ms ⚪ +0% 2 ms 1.00× ➖ differs (as base)
⚪ drilldown detected fields 1h 24 ms 27 ms ⚪ +12% 16 ms 1.69× ➖ differs (as base)
⚪ drilldown detected labels 1h 25 ms 24 ms ⚪ -4% 3 ms 8.00× ➖ differs (as base)
⚪ drilldown landing volume 1h 57 ms 56 ms ⚪ -2% 23 ms 2.43× ➖ differs (as base)
⚪ explore label values env 1h 12 ms 13 ms ⚪ +8% 10 ms 1.30× ✅ same
⚪ explore label values service_name 1h 6 ms 6 ms ⚪ +0% 12 ms 0.50× ✅ same
⚪ explore labels (label browser) 1h 8 ms 9 ms ⚪ +12% 3 ms 3.00× ✅ same
⚪ explore labels with selector 1h 8 ms 9 ms ⚪ +12% 13 ms 0.69× ✅ same
⚪ refresh label values env 1h 21 ms 21 ms ⚪ +0% 11 ms 1.91× ✅ same
⚪ refresh label values service_name 1h 13 ms 10 ms ⚪ -23% 13 ms 0.77× ✅ same
⚪ refresh labels (label browser) 1h 13 ms 15 ms ⚪ +15% 3 ms 5.00× ✅ same
⚪ refresh labels with selector 1h 15 ms 14 ms ⚪ -7% 12 ms 1.17× ✅ same
⚪ DL1 drilldown field breakdown json-expr, level filter 1h 494 ms 499 ms ⚪ +1% 24 ms 21× ✅ same
⚪ DL2 drilldown field breakdown, level + stream-label filter before json 1h 52 ms 49 ms ⚪ -6% 7 ms 7.00× ✅ same
⚪ DL3 drilldown logfmt field breakdown, level filter 1h 625 ms 620 ms ⚪ -1% 91 ms 6.81× ➖ differs (as base)
⚪ DL4 instant count, level filter, json+logfmt, 1h instant 507 ms 525 ms ⚪ +4% 1.37 s 0.38× ✅ sum ±0.32%
⚪ DL6 explore volume, level filter before json 1h 580 ms 557 ms ⚪ -4% 39 ms 14× ✅ sum ±0.31%
⚪ OR1 logs, or alternatives 1h 85 ms 83 ms ⚪ -2% 63 ms 1.32× ✅ same
⚪ OR2 logs, negated or alternatives 1h 87 ms 89 ms ⚪ +2% 50 ms 1.78× ✅ same
⚪ OR3 logs, regexp or alternatives 1h 65 ms 68 ms ⚪ +5% 75 ms 0.91× ✅ same
⚪ OR4 count by level, or alternatives with parser 1h 81 ms 83 ms ⚪ +2% 30 ms 2.77× ✅ same
⚪ OR5 rate, negated regexp or alternatives 1h 56 ms 56 ms ⚪ +0% 85 ms 0.66× ✅ same
⚪ OR6 instant, or alternatives instant 9 ms 8 ms ⚪ -11% 59 ms 0.14× ✅ same
⚪ PR1 count by level, parenthesised json 1h 196 ms 196 ms ⚪ +0% 45 ms 4.36× ✅ same
⚪ PR2 rate, parenthesised line filter 1h 50 ms 48 ms ⚪ -4% 63 ms 0.76× ✅ same
⚪ PR3 bytes by app, parenthesised regexp 1h 52 ms 52 ms ⚪ +0% 68 ms 0.76× ✅ same
⚪ PR4 count by level, parenthesised parser, offset 1h 199 ms 203 ms ⚪ +2% 49 ms 4.14× ✅ same
⚪ PR5 rate by app, pipeline after the range 1h 235 ms 217 ms ⚪ -8% 114 ms 1.90× ✅ same
⚪ PR6 doubly parenthesised range 1h 47 ms 48 ms ⚪ +2% 63 ms 0.76× ✅ same
⚪ PR7 instant, parenthesised line filter instant 8 ms 7 ms ⚪ -12% 59 ms 0.12× ✅ same
⚪ P1 api-gateway empty pattern 1h 23 ms 23 ms ⚪ +0% 7 ms 3.29× ✅ same
⚪ P2 api-gateway not empty pattern, line filter 1h 82 ms 79 ms ⚪ -4% 22 ms 3.59× ✅ same
⚪ P3 nginx count_over_time, pattern with spaces 1h 14 ms 12 ms ⚪ -14% 6 ms 2.00× ✅ same
⚪ P4 nginx count_over_time, GET request pattern 1h 14 ms 14 ms ⚪ +0% 5 ms 2.80× ✅ same
⚪ A1 nginx include GET, log query 1h 20 ms 20 ms ⚪ +0% 10 ms 2.00× ✅ same
⚪ A2 nginx exclude GET, log query 1h 22 ms 21 ms ⚪ -5% 14 ms 1.50× ✅ same
⚪ A3 nginx include GET, count_over_time 1h 1 ms 1 ms ⚪ +0% 2 ms 0.50× ✅ same
⚪ A4 nginx exclude GET, count_over_time 1h 19 ms 19 ms ⚪ +0% 6 ms 3.17× ✅ same
⚪ A5 drilldown exclude, volume by detected_level 1h 26 ms 25 ms ⚪ -4% 5 ms 5.00× ✅ same
⚪ A6 nginx include ends on a literal, log query 1h 13 ms 13 ms ⚪ +0% 5 ms 2.60× ✅ same
⚪ A7 nginx exclude ends on a literal, log query 1h 20 ms 27 ms ⚪ +35% 12 ms 2.25× ✅ same
⚪ A8 nginx include two literals, count_over_time 1h 28 ms 22 ms ⚪ -21% 6 ms 3.67× ✅ same
⚪ A9 nginx include two literals, ends on a literal, count_over_time 1h 20 ms 20 ms ⚪ +0% 5 ms 4.00× ✅ same
⚪ P1 logs, json, level equals 1h 124 ms 128 ms ⚪ +3% 83 ms 1.54× ✅ same
⚪ P2 logs, logfmt, level not equal 1h 31 ms 31 ms ⚪ +0% 5 ms 6.20× ✅ same
⚪ P3 logs, json, level existence 1h 130 ms 127 ms ⚪ -2% 73 ms 1.74× ✅ same
⚪ P4 logfmt count by level 1h 33 ms 32 ms ⚪ -3% 6 ms 5.33× ✅ same
⚪ P5 json count by level 1h 81 ms 83 ms ⚪ +2% 14 ms 5.93× ✅ same
⚪ P6 json count, level filter 1h 15 ms 15 ms ⚪ +0% 12 ms 1.25× ✅ same
⚪ P7 json rate by level, level regexp 1h 19 ms 17 ms ⚪ -11% 13 ms 1.31× ✅ same
⚪ P8 json count by a name that is no stream label 1h 85 ms 88 ms ⚪ +4% 12 ms 7.33× ✅ same
⚪ P9 instant logfmt by level instant 6 ms 8 ms ⚪ +33% 9 ms 0.89× ✅ same
⚪ E1 json duration_ms sum by service 1h 86 ms 84 ms ⚪ -2% 14 ms 6.00× ➖ differs (as base)
⚪ E2 json duration_ms p95 by service 1h 443 ms 428 ms ⚪ -3% 14 ms 31× ✅ same
⚪ E3 logfmt latency_ms rate, production 1h 494 ms 497 ms ⚪ +1% 126 ms 3.94× ➖ differs (as base)
⚪ E4 logfmt size_bytes max by service 1h 47 ms 45 ms ⚪ -4% 15 ms 3.00× ➖ differs (as base)
⚪ E5 json duration_ms sum, instant instant 32 ms 33 ms ⚪ +3% 24 ms 1.38× ✅ same
⚪ E6 logfmt ttl unit string (Loki 400) 1h 400 400 ⚪ -2% 400 — ✅ same
⚪ E7 json hexadecimal trace_id (Loki 400) 1h 400 400 ⚪ +0% 400 — ✅ same
⚪ E8 json duration_ms sum by service, namespace prod 1h 189 ms 194 ms ⚪ +3% 81 ms 2.40× ➖ differs (as base)
⚪ E9 logfmt latency_ms sum by service, namespace prod 1h 303 ms 303 ms ⚪ +0% 92 ms 3.29× ➖ differs (as base)
⚪ D1 logfmt ttl duration_seconds rate by service 1h 53 ms 51 ms ⚪ -4% 11 ms 4.64× ✅ same
⚪ D2 logfmt ttl duration rate by service 1h 51 ms 52 ms ⚪ +2% 10 ms 5.20× ✅ same
⚪ D3 logfmt ttl duration_seconds rate, instant instant 7 ms 9 ms ⚪ +29% 9 ms 1.00× ✅ same
⚪ D4 logfmt ttl duration rate, instant instant 7 ms 9 ms ⚪ +29% 9 ms 1.00× ✅ same
⚪ W1 sum without pod, max_over_time 1h 44 ms 45 ms ⚪ +2% 17 ms 2.65× ➖ differs (as base)
⚪ W2 sum without pod, sum_over_time 1h 43 ms 43 ms ⚪ +0% 15 ms 2.87× ➖ differs (as base)
⚪ W3 sum without pod, rate 1h 138 ms 139 ms ⚪ +1% 15 ms 9.27× ✅ same
⚪ W4 max without pod, max_over_time 1h 45 ms 44 ms ⚪ -2% 16 ms 2.75× ➖ differs (as base)
⚪ W5 sum without pod, max_over_time, instant instant 9 ms 8 ms ⚪ -11% 13 ms 0.62× ✅ same
⚪ W6 sum without pod, rate, instant instant 8 ms 9 ms ⚪ +12% 13 ms 0.69× ✅ same
⚪ W7 topk 5 of sum without pod 1h 44 ms 51 ms ⚪ +16% 17 ms 3.00× ➖ differs (as base)
⚪ W8 sum without pod, count_over_time (production) 1h 867 ms 847 ms ⚪ -2% 0 — ➖ differs (as base)
⚪ W9 label_replace control, instant instant 5 ms 5 ms ⚪ +0% 74 ms 0.07× ✅ same
⚪ U1 logfmt amount rate 1h 36 ms 38 ms ⚪ +6% 13 ms 2.92× ✅ same
⚪ U2 json duration_ms rate 1h 85 ms 88 ms ⚪ +4% 23 ms 3.83× ✅ same
⚪ U3 json duration_ms rate, error filter 1h 86 ms 88 ms ⚪ +2% 27 ms 3.26× ✅ same
⚪ U4 logfmt latency_ms rate, production 1h 350 ms 353 ms ⚪ +1% 124 ms 2.85× ➖ differs (as base)
⚪ U5 logfmt amount rate, instant instant 9 ms 9 ms ⚪ +0% 11 ms 0.82× ✅ same
⚪ U6 json duration_ms rate, instant instant 13 ms 13 ms ⚪ +0% 19 ms 0.68× ✅ same
⚪ U7 json duration_ms sum_over_time, instant instant 14 ms 15 ms ⚪ +7% 19 ms 0.79× ✅ same
⚪ U8 logfmt amount rate by service (grouped) 1h 43 ms 42 ms ⚪ -2% 12 ms 3.50× ✅ same
⚪ U9 logfmt amount rate_counter (folded per series) 1h 297 ms 289 ms ⚪ -3% 32 ms 9.03× ➖ differs (as base)
⚪ U1 json duration_ms sum by service 1h 85 ms 85 ms ⚪ +0% 14 ms 6.07× ➖ differs (as base)
⚪ U10 instant sum_over_time unwrap instant 40 ms 31 ms ⚪ -23% 26 ms 1.19× ✅ same
⚪ U11 instant max_over_time missing label instant 5 ms 6 ms ⚪ +20% 13 ms 0.46× ✅ same
⚪ U12 json duration_ms over every service 1h 240 ms 236 ms ⚪ -2% 40 ms 5.90× ➖ differs (as base)
⚪ U13 logfmt latency_ms over every service 1h 491 ms 497 ms ⚪ +1% 58 ms 8.57× ➖ differs (as base)
⚪ U14 duration() of a unit string 1h 47 ms 46 ms ⚪ -2% 7 ms 6.57× ➖ differs (as base)
⚪ U2 json duration_ms max by service 1h 90 ms 94 ms ⚪ +4% 36 ms 2.61× ➖ differs (as base)
⚪ U3 json duration_ms sliding sum 1h 83 ms 85 ms ⚪ +2% 32 ms 2.66× ➖ differs (as base)
⚪ U4 logfmt size_bytes sum by service 1h 39 ms 41 ms ⚪ +5% 7 ms 5.86× ➖ differs (as base)
⚪ U5 logfmt ttl unit string (no sample) 1h 40 ms 39 ms ⚪ -3% 6 ms 6.50× ✅ same
⚪ U6 missing label, no parser 1h 19 ms 18 ms ⚪ -5% 9 ms 2.00× ✅ same
⚪ U7 missing label, ungrouped sum 1h 17 ms 17 ms ⚪ +0% 9 ms 1.89× ✅ same
⚪ U8 rate of an unwrapped label 1h 87 ms 87 ms ⚪ +0% 14 ms 6.21× ✅ same
⚪ U9 bytes() conversion 1h 51 ms 53 ms ⚪ +4% 12 ms 4.42× ➖ differs (as base)
Cold (first-run) timings — what a user opening a panel sees
shape range base cold PR cold Loki cold PR ÷ Loki cold
by service_name 1h 41 ms 39 ms 763 ms 0.05×
bytes_over_time by app 1h 75 ms 71 ms 771 ms 0.09×
detected_level volume 1h 119 ms 116 ms 668 ms 0.17×
drilldown detected_level 1h 77 ms 80 ms 656 ms 0.12×
drilldown level volume 1h 14 ms 14 ms 664 ms 0.02×
drilldown service landing 1h 39 ms 34 ms 754 ms 0.05×
instant json filtered instant 378 ms 383 ms 71 ms 5.39×
instant json volume instant 470 ms 470 ms 93 ms 5.05×
instant ungrouped rate instant 9 ms 6 ms 69 ms 0.09×
json rate by level (no filter, no drop) 1h 400 400 400 —
json volume no filters 1h 201 ms 200 ms 3 ms 66.67×
logfmt count by level, filter, drop 1h 452 ms 449 ms 1.20 s 0.37×
logfmt volume 1h 239 ms 227 ms 1.37 s 0.17×
logs plain 1h 102 ms 75 ms 47 ms 1.60×
logs | json 1h 97 ms 102 ms 72 ms 1.42×
logs | logfmt 1h 159 ms 157 ms 57 ms 2.75×
plain volume 1h 17 ms 18 ms 780 ms 0.02×
stream-label count by app 1h 27 ms 26 ms 663 ms 0.04×
topk rate by app 1h 43 ms 47 ms 741 ms 0.06×
ungrouped rate 1h 11 ms 11 ms 768 ms 0.01×
DB1 label breakdown pod 1h 119 ms 85 ms 903 ms 0.09×
DB2 label breakdown namespace 1h 17 ms 16 ms 667 ms 0.02×
DB3 json field breakdown user_id 1h 51 ms 52 ms 758 ms 0.07×
DB4 json field breakdown batch_id 1h 104 ms 105 ms 713 ms 0.15×
X1 json filter level_extracted, by level 1h 3.52 s 3.47 s 777 ms 4.47×
X2 json group by level_extracted 1h 300 ms 305 ms 934 ms 0.33×
X3 json rate, level_extracted equality 1h 273 ms 272 ms 589 ms 0.46×
X4 json bytes, level_extracted regexp 1h 380 ms 376 ms 760 ms 0.49×
X5 logfmt filter level_extracted, by level 1h 661 ms 662 ms 1.11 s 0.60×
E1 logs, json parser over stream labels 1h 136 ms 116 ms 68 ms 1.71×
E2 logs, logfmt parser over stream labels 1h 112 ms 115 ms 55 ms 2.09×
E3 logs, json, existence filter on level_extracted 1h 150 ms 139 ms 66 ms 2.11×
E4 logs, logfmt, existence filter on level_extracted 1h 89 ms 93 ms 77 ms 1.21×
E5 logs, json, drop level_extracted 1h 121 ms 119 ms 64 ms 1.86×
E6 logfmt count by level_extracted 1h 59 ms 67 ms 51 ms 1.31×
E7 json count by level_extracted 1h 1.40 s 1.40 s 189 ms 7.42×
E8 instant logfmt by level_extracted instant 8 ms 11 ms 10 ms 1.10×
A explore volume, 2 filters, drop 1h 3.01 s 1.53 s 600 ms 2.56×
B grouped sum, filter, no drop 1h 123 ms 124 ms 574 ms 0.22×
C ungrouped sum, filter, no drop 1h 121 ms 118 ms 580 ms 0.20×
D volume, no filters 1h 219 ms 215 ms 1.03 s 0.21×
E field breakdown pipeline (explore) 1h 113 ms 110 ms 642 ms 0.17×
F field breakdown service_version (explore) 1h 1.36 s 1.32 s 946 ms 1.39×
G field breakdown pipeline (drilldown) 1h 46 ms 44 ms 650 ms 0.07×
H field breakdown service_version (drilldown) 1h 139 ms 139 ms 681 ms 0.20×
I grafana volume of B 1h 112 ms 110 ms 748 ms 0.15×
O2 explore log volume (Grafana form), underscore structured-metadata filter 1h 189 ms 157 ms 610 ms 0.26×
label values env ending now 1h 3 ms 3 ms 10 ms 0.30×
label values env ending two days ago (control) 1h 7 ms 9 ms 3 ms 3.00×
labels ending now 1h 23 ms 2 ms 3 ms 0.67×
labels ending two days ago (control) 1h 4 ms 4 ms 3 ms 1.33×
drilldown detected fields 1h 25 ms 30 ms 22 ms 1.36×
drilldown detected labels 1h 35 ms 28 ms 3 ms 9.33×
drilldown landing volume 1h 60 ms 60 ms 21 ms 2.86×
explore label values env 1h 83 ms 83 ms 10 ms 8.30×
explore label values service_name 1h 44 ms 42 ms 12 ms 3.50×
explore labels (label browser) 1h 23 ms 2 ms 3 ms 0.67×
explore labels with selector 1h 65 ms 57 ms 13 ms 4.38×
refresh label values env 1h 3 ms 3 ms 11 ms 0.27×
refresh label values service_name 1h 2 ms 2 ms 13 ms 0.15×
refresh labels (label browser) 1h 2 ms 2 ms 3 ms 0.67×
refresh labels with selector 1h 2 ms 2 ms 13 ms 0.15×
DL1 drilldown field breakdown json-expr, level filter 1h 507 ms 490 ms 550 ms 0.89×
DL2 drilldown field breakdown, level + stream-label filter before json 1h 88 ms 83 ms 31 ms 2.68×
DL3 drilldown logfmt field breakdown, level filter 1h 645 ms 631 ms 1.19 s 0.53×
DL4 instant count, level filter, json+logfmt, 1h instant 502 ms 504 ms 1.37 s 0.37×
DL6 explore volume, level filter before json 1h 1.08 s 1.03 s 823 ms 1.25×
OR1 logs, or alternatives 1h 81 ms 81 ms 73 ms 1.11×
OR2 logs, negated or alternatives 1h 69 ms 72 ms 53 ms 1.36×
OR3 logs, regexp or alternatives 1h 65 ms 61 ms 67 ms 0.91×
OR4 count by level, or alternatives with parser 1h 124 ms 124 ms 494 ms 0.25×
OR5 rate, negated regexp or alternatives 1h 55 ms 58 ms 694 ms 0.08×
OR6 instant, or alternatives instant 7 ms 9 ms 62 ms 0.15×
PR1 count by level, parenthesised json 1h 241 ms 200 ms 944 ms 0.21×
PR2 rate, parenthesised line filter 1h 48 ms 47 ms 491 ms 0.10×
PR3 bytes by app, parenthesised regexp 1h 55 ms 52 ms 672 ms 0.08×
PR4 count by level, parenthesised parser, offset 1h 200 ms 200 ms 851 ms 0.24×
PR5 rate by app, pipeline after the range 1h 224 ms 224 ms 918 ms 0.24×
PR6 doubly parenthesised range 1h 48 ms 50 ms 599 ms 0.08×
PR7 instant, parenthesised line filter instant 8 ms 7 ms 61 ms 0.11×
P1 api-gateway empty pattern 1h 45 ms 23 ms 75 ms 0.31×
P2 api-gateway not empty pattern, line filter 1h 87 ms 72 ms 23 ms 3.13×
P3 nginx count_over_time, pattern with spaces 1h 13 ms 12 ms 24 ms 0.50×
P4 nginx count_over_time, GET request pattern 1h 14 ms 13 ms 27 ms 0.48×
A1 nginx include GET, log query 1h 44 ms 21 ms 9 ms 2.33×
A2 nginx exclude GET, log query 1h 20 ms 19 ms 11 ms 1.73×
A3 nginx include GET, count_over_time 1h 1 ms 1 ms 2 ms 0.50×
A4 nginx exclude GET, count_over_time 1h 19 ms 20 ms 37 ms 0.54×
A5 drilldown exclude, volume by detected_level 1h 48 ms 40 ms 31 ms 1.29×
A6 nginx include ends on a literal, log query 1h 14 ms 14 ms 22 ms 0.64×
A7 nginx exclude ends on a literal, log query 1h 22 ms 21 ms 12 ms 1.75×
A8 nginx include two literals, count_over_time 1h 23 ms 22 ms 31 ms 0.71×
A9 nginx include two literals, ends on a literal, count_over_time 1h 20 ms 21 ms 24 ms 0.88×
P1 logs, json, level equals 1h 161 ms 131 ms 79 ms 1.66×
P2 logs, logfmt, level not equal 1h 31 ms 31 ms 43 ms 0.72×
P3 logs, json, level existence 1h 126 ms 127 ms 72 ms 1.76×
P4 logfmt count by level 1h 33 ms 31 ms 48 ms 0.65×
P5 json count by level 1h 92 ms 90 ms 180 ms 0.50×
P6 json count, level filter 1h 15 ms 16 ms 161 ms 0.10×
P7 json rate by level, level regexp 1h 24 ms 17 ms 185 ms 0.09×
P8 json count by a name that is no stream label 1h 102 ms 94 ms 151 ms 0.62×
P9 instant logfmt by level instant 8 ms 6 ms 9 ms 0.67×
E1 json duration_ms sum by service 1h 105 ms 82 ms 194 ms 0.42×
E2 json duration_ms p95 by service 1h 433 ms 414 ms 205 ms 2.02×
E3 logfmt latency_ms rate, production 1h 493 ms 515 ms 1.15 s 0.45×
E4 logfmt size_bytes max by service 1h 44 ms 46 ms 183 ms 0.25×
E5 json duration_ms sum, instant instant 35 ms 36 ms 24 ms 1.50×
E6 logfmt ttl unit string (Loki 400) 1h 400 400 400 —
E7 json hexadecimal trace_id (Loki 400) 1h 400 400 400 —
E8 json duration_ms sum by service, namespace prod 1h 190 ms 188 ms 631 ms 0.30×
E9 logfmt latency_ms sum by service, namespace prod 1h 305 ms 302 ms 735 ms 0.41×
D1 logfmt ttl duration_seconds rate by service 1h 77 ms 52 ms 52 ms 1.00×
D2 logfmt ttl duration rate by service 1h 54 ms 50 ms 50 ms 1.00×
D3 logfmt ttl duration_seconds rate, instant instant 8 ms 9 ms 9 ms 1.00×
D4 logfmt ttl duration rate, instant instant 8 ms 8 ms 9 ms 0.89×
W1 sum without pod, max_over_time 1h 65 ms 45 ms 97 ms 0.46×
W2 sum without pod, sum_over_time 1h 43 ms 41 ms 108 ms 0.38×
W3 sum without pod, rate 1h 138 ms 135 ms 89 ms 1.52×
W4 max without pod, max_over_time 1h 42 ms 45 ms 101 ms 0.45×
W5 sum without pod, max_over_time, instant instant 8 ms 8 ms 13 ms 0.62×
W6 sum without pod, rate, instant instant 10 ms 7 ms 13 ms 0.54×
W7 topk 5 of sum without pod 1h 45 ms 41 ms 106 ms 0.39×
W8 sum without pod, count_over_time (production) 1h 865 ms 822 ms 0 —
W9 label_replace control, instant instant 6 ms 6 ms 73 ms 0.08×
U1 logfmt amount rate 1h 58 ms 39 ms 58 ms 0.67×
U2 json duration_ms rate 1h 89 ms 107 ms 157 ms 0.68×
U3 json duration_ms rate, error filter 1h 89 ms 91 ms 210 ms 0.43×
U4 logfmt latency_ms rate, production 1h 347 ms 353 ms 1.08 s 0.33×
U5 logfmt amount rate, instant instant 9 ms 7 ms 11 ms 0.64×
U6 json duration_ms rate, instant instant 13 ms 13 ms 19 ms 0.68×
U7 json duration_ms sum_over_time, instant instant 17 ms 15 ms 20 ms 0.75×
U8 logfmt amount rate by service (grouped) 1h 44 ms 42 ms 69 ms 0.61×
U9 logfmt amount rate_counter (folded per series) 1h 298 ms 294 ms 330 ms 0.89×
U1 json duration_ms sum by service 1h 108 ms 85 ms 215 ms 0.40×
U10 instant sum_over_time unwrap instant 43 ms 35 ms 26 ms 1.35×
U11 instant max_over_time missing label instant 6 ms 6 ms 14 ms 0.43×
U12 json duration_ms over every service 1h 259 ms 236 ms 814 ms 0.29×
U13 logfmt latency_ms over every service 1h 497 ms 493 ms 1.11 s 0.44×
U14 duration() of a unit string 1h 45 ms 43 ms 54 ms 0.80×
U2 json duration_ms max by service 1h 91 ms 94 ms 858 ms 0.11×
U3 json duration_ms sliding sum 1h 84 ms 85 ms 239 ms 0.36×
U4 logfmt size_bytes sum by service 1h 40 ms 38 ms 48 ms 0.79×
U5 logfmt ttl unit string (no sample) 1h 39 ms 41 ms 43 ms 0.95×
U6 missing label, no parser 1h 20 ms 18 ms 80 ms 0.22×
U7 missing label, ungrouped sum 1h 16 ms 16 ms 78 ms 0.21×
U8 rate of an unwrapped label 1h 86 ms 89 ms 200 ms 0.44×
U9 bytes() conversion 1h 50 ms 52 ms 52 ms 1.00×
Why these shapes
  • internal/translator/translator.go → 112: control/bytes_over_time by app, control/instant json filtered, control/instant json volume, control/instant ungrouped rate, control/json rate by level (no filter, no drop), control/json volume no filters, control/logfmt count by level, filter, drop, control/logfmt volume …
  • internal/proxy/ordered_json_metric.go → 73: control/bytes_over_time by app, control/instant json filtered, control/instant json volume, control/json rate by level (no filter, no drop), control/json volume no filters, control/logfmt count by level, filter, drop, control/logfmt volume, control/logs | json …
  • internal/proxy/query_translation.go → 38: control/bytes_over_time by app, control/instant json volume, control/instant ungrouped rate, control/json rate by level (no filter, no drop), control/json volume no filters, control/logfmt count by level, filter, drop, control/logfmt volume, control/logs | json …
  • internal/proxy/range_metric_compat.go → 21: control/bytes_over_time by app, control/instant json volume, control/instant ungrouped rate, control/json volume no filters, control/stream-label count by app, control/topk rate by app, control/ungrouped rate, json-filter-pushdown/A explore volume, 2 filters, drop …
  • cmd/proxy/main.go → 20: control/by service_name, control/bytes_over_time by app, control/detected_level volume, control/drilldown detected_level, control/drilldown level volume, control/drilldown service landing, control/instant json filtered, control/instant json volume …
  • internal/proxy/label_metadata.go → 12: metadata-freshness/label values env ending now, metadata-freshness/label values env ending two days ago (control), metadata-freshness/labels ending now, metadata-freshness/labels ending two days ago (control), metadata-inventory/explore label values env, metadata-inventory/explore label values service_name, metadata-inventory/explore labels (label browser), metadata-inventory/explore labels with selector …
  • internal/proxy/backend.go → 11: metadata-inventory/drilldown detected fields, metadata-inventory/drilldown detected labels, metadata-inventory/drilldown landing volume, metadata-inventory/explore label values env, metadata-inventory/explore label values service_name, metadata-inventory/explore labels (label browser), metadata-inventory/explore labels with selector, metadata-inventory/refresh label values env …
  • control smoke → 8: control/drilldown service landing, control/instant ungrouped rate, control/json rate by level (no filter, no drop), control/json volume no filters, control/logs plain, control/logs | json, control/stream-label count by app, control/topk rate by app
  • internal/proxy/proxy.go (endpoint handler) → 8: control/drilldown service landing, control/instant ungrouped rate, control/json rate by level (no filter, no drop), control/json volume no filters, control/logs plain, control/logs | json, control/stream-label count by app, control/topk rate by app
  • internal/proxy/sliding_window_stats.go → 4: drilldown-breakdown-exact/DB1 label breakdown pod, drilldown-breakdown-exact/DB2 label breakdown namespace, drilldown-breakdown-exact/DB3 json field breakdown user_id, drilldown-breakdown-exact/DB4 json field breakdown batch_id

base f5c05e3ad7 → PR 2b7e7304e9 · 4 runs (first is cold), warm p50 · ranges 1h · noise ±30% and 100 ms · VictoriaLogs restarts 0→0 · 20.3 min. Same runner, one fresh stack, targets interleaved per request. How to read and reproduce: bench/ab/README.md.

This branch has not been deployed

No deployments
Sign up for free to join this conversation on GitHub. Already have an account? Sign in to comment

Labels

scope/ci CI/CD scope/cli CLI flags scope/docs Documentation scope/helm Helm chart scope/proxy Proxy core scope/tests Tests scope/translator LogQL translator size/XL Extra large change

Projects

None yet

Development

Successfully merging this pull request may close these issues.

1 participant