Skip to content

perf: | json | __error__="" metrics are counted by VictoriaLogs stats, reading only the doubtful lines - #758

Open
szibis wants to merge 4 commits into
mainfrom
perf/json-valid-split
Open

szibis wants to merge 4 commits into
mainfrom
perf/json-valid-split

Conversation

@szibis

@szibis szibis commented Oct 12, 2026 •

Copy link
Copy Markdown
Collaborator

Summary

Rebased onto #760. The A/B and e2e numbers below were measured before
this rebase (and before the detected_level grouping was reduced to the stored
level fields, see "detected_level") and are re-measured next; they are not
claims about this head.

| json | __error__="" metrics are counted by one VictoriaLogs stats scan
instead of reading every selected line as a raw row. Only the brace-opened
lines VictoriaLogs cannot vouch for are read raw, and only from the buckets
that hold them. Before this change these shapes took 0.5-2.4 s at 1 h (Loki
0.01-0.05 s) and failed with a 502 on the row or byte limit at 6-24 h.

Pre-existing exactness difference. On a 3000-line crafted corpus on a
real stack, Loki answers a {a=""} series for a parsed key with an empty
value ({"a":""}, or a lone surrogate that Loki's unescape turns into ""),
separate from the lines without the key. The proxy merges those lines into
{}. Main and this branch answer the same: a three-way comparison of Loki,
main and branch over 7 shapes showed branch == main on every shape, and
branch == Loki on all except sum by (a) and sum by (b), which differ only
in the empty-value series. This is registered as the open case
semantics/json-empty-value-label-series.

Why VictoriaLogs cannot do it alone

Loki counts the lines its JSON parser accepts (pkg/logql/log/parser.go:74-135
JSONParser.Process). The parser walks a nested object only when a required
label starts with its key path (parser_hints.go ShouldExtractPrefix), so
whether a line fails with JSONParserErr depends on the query. VictoriaLogs
attaches no parser error, and its parser (fastjson) accepts constructs that
Loki's (grafana/jsonparser) rejects, and the other way round. No single LogsQL
filter matches Loki's error.

What VictoriaLogs does and what the proxy adds

The pushdown splits the selected lines into three sets:

  1. Dropped. A line that does not open with { after space, tab, line feed
    or carriage return fails ObjectEach (jsonparser nextToken), so Loki drops
    it.
  2. Counted by VictoriaLogs. These are lines VictoriaLogs parses as one JSON
    object and that hold none of the rejected constructs (jsonLokiRejectHazard).
    • The parse is checked by splicing "__vlp":1, after the opening brace and
      reading the key back with unpack_json. The splice cannot repair a broken
      line; wrapping the line in a new object could be closed by trailing text.
    • The rejected constructs are a backslash in a key, a member value starting
      with . e E +, and NaN or Inf.
    • Loki accepts every such line under every hint set, so the VictoriaLogs
      count is exact.
  3. Read as raw rows. Every other brace-opened line is counted per bucket in
    the same scan (count() if (-__vlp:*)). It is read raw only from those
    buckets, with a | fields projection, and evaluated by the row evaluator,
    whose parser follows Loki's hints.

How the parts fit together:

  • Hazard probe. A cached | limit 1 probe looks for the rejected
    constructs. Only when it finds one does the scan run again with such lines
    moved to the raw rows.
  • Parse-risk probes. The probes for parsed labels now check only lines
    VictoriaLogs parses, because every other line is evaluated raw.
  • Merging. At each evaluation point the bucket counts and the raw lines are
    summed (a raw line at t is a sample at t-1ns, the same window rule as the
    bucket labels). metricWindowValue then runs once.
  • Series limit. VictoriaLogs groups are not Loki series, so no count of
    them says how many series the answer holds. It emits a group, with zero
    counts, for every row that reaches stats; it groups the spellings of one
    level apart (info, INFO, inf and information are four groups and one
    detected_level series); it groups an empty service name apart from
    unknown_service; and with a step wider than the range it groups lines that
    fall between two evaluation windows, which have no point in the answer. The
    split therefore never ends with the series limit error from a group count.
    • Label filters run first, as a pre-filter
      (| filter (<raw> or (<filters>))), and the lines read as raw rows lose
      the grouped fields. They are marked once
      (| format if (<doubtful line>) "1" as __vlr) and blanked on the marker
      (| format if (__vlr:*) "" as <field>), so they are counted per bucket
      whatever their labels (the row evaluator derives those itself) and form one
      group. The marker never becomes a grouped field or a label.
    • Only the merged answer is checked against -max-stats-query-series, with
      Loki's error: after the groups are keyed by their Loki labels
      (lokiStatsSeries), the series without a point in any evaluation window
      are dropped (dropSeriesWithoutPoints), and again once the raw rows are
      added. The first check runs before any raw row is read.
    • The stats read keeps at most twice the series limit in groups
      (splitGroupSlack) as a memory guard: a 300,000 group response is not
      parsed whole (+2.2 GiB heap before; bounded now). A read past it
      (errStatsGroupGuard), or a response too large to read
      (maxStatsBucketResponseBytes), only means the split does not answer. The
      row evaluator does, exactly as on main: its own row and byte limits
      (-manual-range-metric-row-limit, -ordered-json-metric-max-bytes) apply,
      and Loki's series limit error where its own series exceed the limit. Only a
      split plan falls back on a response too large to read; every other
      pushdown, and the logs volume route, keep main's behaviour byte for byte.
    • Grafana Logs Drilldown requests (which keep the busiest series of an
      over-limit answer) and groupings by a field starting with _ (_msg,
      _time, _stream: not fields to blank) do not take the split; they behave
      as on main.
  • service_name. It is the stream label Loki assigns at ingest. VictoriaLogs
    takes the first non-empty source field that is a stream label of the row (a
    stream filter {app!=""} in format if, as deriveServiceName reads it),
    never structured metadata, as the row evaluator does (ensureSyntheticServiceName over _stream).
    TestJSONValidSplitServiceNameFromMetadata pins it.
  • Projection for the existing raw path. The row evaluator's raw read (and
    its fallback paths) keeps _time, _stream, _msg, level plus every stored
    field that can expose a required label: its own name, its ToVL spelling, a
    custom mapping, or a field it sanitizes from (<leading letters>*). Plans
    without parser hints keep every field.
  • Form feed. The one-row pipeline-error lookup used RE2 \s, which
    includes the form feed. It now uses Loki's JSON whitespace.

Behaviour change: the row evaluator's guards (nesting depth 64, 1024 fields,
1 MiB line, 64 KiB value) now apply only to the raw-row set. A line VictoriaLogs
vouches for is counted as Loki counts it, however wide and up to 300 levels deep
(VictoriaLogs' JSON parser limit); a deeper line is read raw and keeps the
row evaluator's depth guard.

Limits: the raw rows share -manual-range-metric-row-limit and
-ordered-json-metric-max-bytes, with their existing errors. The raw reads are
at most 16 time ranges, then their hull.

VictoriaLogs support (read in the v1.40.0, v1.47.0 and v1.52.0 sources): every
pipe and filter used (replace_regexp ... at, copy, unpack_json from ... fields (...), stats ... if (...), format if (...), stream filters {f!=""},
fields prefix*) exists in all three, format if (...) "" as <field> included (pipe_format_test.go:16,28 parse it in v1.40.0, v1.47.0 and v1.52.0; pipe_format.go writeBlock at :121, :125, :125 writes the empty string on matching rows and keeps the original value on the others); the service_name derivation is a chain of
format if pipes, no capability-gated pipe is used. unpack_json differs: v1.40
and v1.47 require { as the first byte of the value, v1.52 trims JSON whitespace
(trimJSONWhitespace) before that check. The split holds on both: the sentinel
splice is anchored at the line start, so a line with leading whitespace never
gets the sentinel on either version and is read raw, and the hazard probe uses
the same brace-start filter as the split. fastjson is v1.6.4 in v1.40.0 and
v1.6.10 in v1.47.0 and v1.52.0, MaxDepth 300 in all.

detected_level

Loki sets detected_level at ingest, normalized (pkg/distributor/field_detection.go
extractLogLevel, normalizeLogLevel). How a sum by (detected_level) over a
JSON pipeline derives it, for the row evaluator and for the stats pushdown, is
#760's. This change adds the split on top of it and keeps its answer Loki's:

  • A split plan grouped by detected_level asks VictoriaLogs for the stored
    level fields alone (copy detected_level as __dl_d, level as __dl_l, taken
    before the sentinel splice, the marker or any unpack), validated by
    storedLevelSeries. It never builds the derivation chain, the presence probe
    or the witness.
  • It is served only when every counted group has a stored level and no stored
    detected_level; the spellings of one level are separate groups and one
    series, merged after the read, so the series limit counts series.
  • The lines read as raw rows are decided by the row evaluator's own derivation,
    never by the copies (the marker blanks them for those lines).
  • Any doubtful window takes the row evaluator, which derives the level of every
    line itself: a level only the body holds, a counted line without one, a stored
    detected_level label, another stored level field (severity, lvl, OTLP
    severity: the copy of level cannot tell a stream label from metadata, which
    Loki ranks, found by a | limit 1 probe), a read past the group guard, a
    response too large to read. A filter on detected_level is not split. Speed never outranks Loki's
    answer.
  • The raw read of a plan that derives the level keeps every field of the rows
    (the projection to the plan's labels would hide the stored severity,
    severity_text and severity_number the derivation reads).
  • Tests: TestJSONValidSplitDetectedLevelWindowsMatchTheRowEvaluator (mixed
    stored and body-only windows, a stored detected_level label, unnormalised
    spellings, OTLP severity only, raw lines with and without a stored level: the
    split's answer equals the row evaluator's and the path taken is asserted),
    TestJSONValidSplitMatchesRawEvaluator (seeded, both fixtures),
    TestJSONValidSplitLevelSpellingsMergeUnderTheLimit,
    TestOrderedJSONRowProjectionKeepsTheStoredLevelFields, and the e2e
    TestRangeMetricCompatibilityJSONErrorFilterSplitDetectedLevel (CI group
    semantics, against real Loki: body levels, stream levels in mixed spellings,
    a counted line without a stored level, lines nested deeper than VictoriaLogs
    reads).

Tests

  • TestJSONValidSplitPredicateDifferential and FuzzJSONValidSplitPredicate
    (wired into the fuzz smoke job). They check the LogsQL the pushdown sends,
    evaluated with VictoriaLogs semantics (fastjson), against a port of Loki's
    acceptance under four hint sets:

    • a line VictoriaLogs counts is accepted by Loki under every hint set;
    • a dropped line is rejected under every hint set.

    The corpus is 200k seeded lines, plus 90 s of fuzzing. With the hazard
    exclusion removed, the same corpus finds about 10k violations.

  • TestJSONLokiRejectHazardTable: a unit table of the rejected constructs.

  • TestJSONValidSplitEligibility: which shapes take the split.

  • TestJSONValidSplitMatchesRawEvaluator: a differential of the hybrid against
    the proxy's row evaluator.

    • Coverage: count, rate and bytes; ungrouped, by stream label, by parsed
      label, by service_name, with a label filter, and by detected_level.
    • Data: a seeded fixture with hazards, rows on evaluation edges, and a fake
      backend with fastjson semantics.
    • It also asserts one stats scan (two with a hazard) and bounded raw reads.
    • Mutation check: dropping the 1 ns shift or the hazard exclusion fails it.
  • Series limit and probes:

    • TestJSONValidSplitFilteredOutGroupsStayUnderSeriesLimit and
      ...FilteredOutGroupsUnderSizeCap (a filter keeping 2 of 20 paths under
      limit 5, count and bytes, with the response cap at 1200, 2000 and 4000
      bytes; both fail with the pre-filter line removed).
    • TestJSONValidSplitRawOnlyGroupIsNotASeries (exactly the limit's paths plus
      an unparseable line answer; one more is Loki's error).
    • TestJSONValidSplitRawCandidatesFormOneGroup (50 hazard lines over distinct
      service_name, level and parsed key: one raw group in the stats response, a
      limit of 10 answers the three real series) and
      ...RawCandidatesOverManyStreamsFormOneGroup (20 truncated-JSON lines over
      20 apps in the first scan, no rescan, limit 3 answers). Both fail with the
      blanking removed; the second fails with it applied to the hazard scan only.
    • TestJSONValidSplitReadStopsAtTwiceTheSeriesLimit: 300,000 groups, limit
      500: a plain pushdown stops with Loki's error, a split read with
      errStatsGroupGuard; both allocate under 8 MiB for a 47.5 MiB body.
      TestJSONValidSplitHugeResponseFallsBackWithBoundedMemory runs it through
      the handler: the row evaluator answers (empty here), 200, under 24 MiB.
      Both fail with the guard removed.
    • TestJSONValidSplitMergedAnswerOverTheLimitReturnsLokiError: 8 groups,
      limit 5 (within the guard), count, bytes_over_time and bytes_rate, with
      and without a raw candidate: Loki's 400 from the merged answer, no raw
      read. Fails with the early cap removed (raw candidate) and with the final
      cap removed (none).
    • TestJSONValidSplitLimitPlusOneSeriesWithoutRawRows: 6 series, limit 5,
      no raw line: the 400 (fails with the final cap removed); limit 6 answers.
    • TestJSONValidSplitSeriesLimitFailsBeforeRawRows: five real paths, a valid
      line without the key and an unparseable line pass the read and exceed the
      limit once merged; the query ends with the 400 and issues no raw read
      (fails with the early cap removed; limit 6 answers as the row evaluator).
    • TestJSONValidSplitOverTwiceTheLimitGroupsFallBackToRowEvaluator: 60
      groups, limit 5, with the guard first, the size cap before it, a response
      too large to read and one smaller than a group: always the row evaluator's
      answer (the 400 here, 200 at limit 60 with all 60 series). Fails with the
      old stop (limit plus one group) restored.
    • TestJSONValidSplitLevelSpellingsMergeUnderTheLimit: 8 level spellings
      (info, INFO, Info, inf, information, warn, WARN, warning), as a stream label
      (served by the split) or in the body (the row evaluator answers), with and
      without a raw candidate. Limits 5 and 10: Loki's two series, no raw read
      without a candidate when the level is stored; limit 3: past the guard, the
      row evaluator answers the same two series. The expected answer is counted
      independently of both evaluators.
    • TestJSONValidSplitGapGroupsAreNoSeries: step 5m, range 1m, limit 5: 3
      series with a point, 4 groups only in the gaps and a raw candidate in a
      gap; the row evaluator's 3 series answer (before, a 400). Fails with
      dropSeriesWithoutPoints removed.
    • TestJSONValidSplitOversizedResponseOnlyFallsBackForSplitPlans: the same
      oversized response is a fallback for a split plan and errBodyTooLarge,
      as on main, for a plain pushdown plan (fails with the gate on validOnly
      removed).
    • TestJSONValidSplitDrilldownRequestsKeepTheRowEvaluator: a Drilldown
      request gets the busiest 5 of 8 series with no stats query sent (fails with
      the exclusion removed).
    • TestJSONValidSplitEligibility gained sum by (_msg), (_stream),
      (app, _time) and a _msg filter: no pushdown (fails with the exclusion
      removed).
    • TestJSONValidSplitMarksRawCandidatesOnce: the doubtful-line condition
      appears once in each stats query (count and bytes, with a hazard rescan),
      the marker is no grouped field and no label (fails with the per-field
      condition restored).
    • TestJSONValidSplitResponseTooLargeFallsBackToRawEvaluator: a response over
      the cap within the limit answers as the row evaluator.
    • TestJSONValidSplitHazardProbeUsesTheSplitBraceFilter,
      TestJSONValidSplitHazardProbeCancelsTheFirstScan (it failed 1 run in 20
      on the previous head too: the first scan could be cancelled before its
      request left the proxy; that is a valid cancel now, 60 runs pass),
      TestJSONValidSplitServiceNameFromStreamLabelWithNewline.
    • The test fake emits a zero point for a stats column whose if condition
      fails, as VictoriaLogs writes every column for every group, models v1.52's
      JSON whitespace trim, and evaluates format if (...) "" as <field> and the
      "1" marker.
  • TestJSONValidSplitReadsOnlyRawRowBuckets, TestJSONValidSplitCountsDeepLinesLikeLoki,
    TestJSONValidSplitServiceNameFromMetadata,
    TestOrderedJSONRowProjection, TestOrderedJSONRowSpans,
    TestOrderedJSONPipelineErrorFormFeedLine.

  • e2e: TestRangeMetricCompatibilityJSONErrorFilterSplit (group semantics),
    against real Loki on a crafted fixture.

    • The fixture holds NaN, .5, +1, an invalid key escape, trailing text,
      truncated JSON, {}, leading whitespace, plain and logfmt lines.
    • Shapes: count, rate and bytes; ungrouped, by stream label, by parsed label,
      by service_name, by three labels (level, service_name, status), by two
      labels with a filter, and with a filter.
    • Green on VictoriaLogs v1.52.0 and v1.47.0, on a fresh isolated stack each
      (Loki, VictoriaLogs and proxy readiness checked before the first test):
      TestSetup_IngestLogs, every TestRangeMetricCompatibility* (including
      ...JSONFilterPushdown and ...JSONLogsVolume),
      TestCompat_ExtractedLabelMetricPushdown, TestCompat_SanitizedJSONKey*
      and TestCompat_ExtractedSuffixOnParsedCollision: 227 passed, 0 failed, 1
      skipped on each (the Drilldown partial-result subtest, skipped before this
      change too), VictoriaLogs restart count 0 -> 0.
    • With the hazard re-scan disabled, it fails on real VictoriaLogs.
    • TestRangeMetricCompatibilityJSONErrorFilterSplitSeriesLimit: an in-process
      proxy with -max-stats-query-series=5 against real Loki. A label filter
      keeping 2 of 20 paths, and exactly 5 paths plus a trailing-text line that
      VictoriaLogs cannot parse, answer as Loki does; one path more is Loki's
      series limit error, from the row evaluator the 20 groups are handed to (the last subtest also asserts Loki holds all 20 paths,
      its own limit being higher). The last subtest used a step of 300 s with a
      1 m range, so most evaluation points saw no line; the previous commit's 400
      counted VictoriaLogs groups that no evaluation point saw, and the proxy now
      returns the series it has points for. (Loki's answer to that exact query was
      not checked: its compose config aligns queries with the step.) The subtest
      now uses a step of the range (60 s), where every point sees lines, and Loki's
      20 series are asserted.
    • TestRangeMetricCompatibilityJSONErrorFilterSplitDetectedLevel:
      sum by (detected_level) of count and bytes against real Loki on four
      fixtures: the level only in the body (the row evaluator answers), as a
      stream label in 11 spellings (the stats over the stored level fields
      answer, asserted from the backend calls: no chain, no row read), a counted
      line without a stored level among stored ones (the row evaluator), and the
      level in the body of lines nested deeper than VictoriaLogs reads (stored
      level fields for the counted lines, the row evaluator for the raw rows).
      Targets: the stack proxy, an in-process proxy, and an in-process proxy with
      -max-stats-query-series=5 where the groups pass the guard and the row
      evaluator answers. Each target equals Loki's series.
  • A 3000-line crafted corpus on the same stack: this branch equals main on
    every shape. It equals Loki except a parsed key with an empty value (see
    Registry).

A/B

Measured before the rebase onto #760; re-measured next.

Head 0bdb38c9 (the last commit only adds these results) against origin/main
(1dcb79e0), run with bench/ab/pr_smoke.py on fresh, isolated stacks
(Loki 3.7.7, VictoriaLogs v1.52.0), both builds as host processes with their
tree's stack flags, the targets interleaved per request. Commands:

python3 bench/ab/pr_smoke.py --base origin/main --head HEAD --ranges 1h --runs 5 \
  --confirm-runs 7 --timeout 120 --selection <json-error-split + control>   # 1 h, with Loki
PQ_RANGES=6h,24h python3 <pr_smoke with Loki unseeded> --base origin/main --head HEAD \
  --runs 5 --timeout 120 --selection <json-error-split>                     # VictoriaLogs only

The 1 h run has 87 min of generator data in both backends; the 6 h and 24 h
runs have it in VictoriaLogs only, so those rows have no Loki column. Every
request carries a client timeout of 120 s; main answered a 502 (the row or
byte limit), never a timeout, on the shapes marked 502. VictoriaLogs restart
count: 0 -> 0 on every run, and 0 after the fallback measurements. Summaries:
bench/ab/results/2026-10-13-json-error-split-{1h,long,control-1h}.json.

json-error-split — json-error-split-1h (2026-10-13, 5 runs, warm p50; VictoriaLogs restarts 0→0)

shape range base pr loki change result vs loki
J1 json no-error count by service_name, one service 1h 0.57s 0.03s 0.01s 22.04× same
J2 json no-error count by app, namespace 1h 1.70s 0.06s 0.04s 28.33× same
J3 json no-error count by parsed method 1h 0.56s 0.03s 0.02s 17.62× same
J4 json no-error count by service_name, all services 1h 2.44s 0.07s 0.05s 33.96× same
J5 json no-error bytes_rate by app 1h 1.75s 0.07s 0.04s 24.94× same

Verdict: 5 shape×range — 5 faster; results: 0 new difference(s) from loki, 0 pre-existing (also on base).

json-error-split — json-error-split-long (2026-10-13, 5 runs, warm p50; VictoriaLogs restarts 0→0)

shape range base pr loki change result vs loki
J1 json no-error count by service_name, one service 6h 3.33s 0.10s — 34.01× n/a
J1 json no-error count by service_name, one service 24h 502 0.39s — fixed n/a
J2 json no-error count by app, namespace 6h 502 0.31s — fixed n/a
J2 json no-error count by app, namespace 24h 502 1.17s — fixed n/a
J3 json no-error count by parsed method 6h 3.29s 0.12s — 26.72× n/a
J3 json no-error count by parsed method 24h 502 0.46s — fixed n/a
J4 json no-error count by service_name, all services 6h 502 0.45s — fixed n/a
J4 json no-error count by service_name, all services 24h 502 1.44s — fixed n/a
J5 json no-error bytes_rate by app 6h 502 0.28s — fixed n/a
J5 json no-error bytes_rate by app 24h 502 1.04s — fixed n/a

Verdict: 10 shape×range — 8 fixed, 2 faster; results: 0 new difference(s) from loki, 0 pre-existing (also on base).

Control set at 1 h (no degradation; no shape of it uses the split):

control — json-error-split-control-1h (2026-10-13, 5 runs, warm p50; VictoriaLogs restarts 0→0)

shape range base pr loki change result vs loki
logs plain 1h 0.03s 0.03s 0.03s same same
logs | json 1h 0.04s 0.04s 0.04s same same
logs | logfmt 1h 0.07s 0.07s 0.03s same same
json volume no filters 1h 0.04s 0.04s 0.02s same same
logfmt volume 1h 0.05s 0.06s 0.03s same same
plain volume 1h 0.01s 0.01s 0.02s same same
stream-label count by app 1h 0.01s 0.01s 0.02s same same
ungrouped rate 1h 0.01s 0.01s 0.04s same same
bytes_over_time by app 1h 0.03s 0.03s 0.04s same same
topk rate by app 1h 0.02s 0.02s 0.04s same differs
detected_level volume 1h 0.01s 0.01s 0.02s same same
by service_name 1h 0.01s 0.01s 0.02s same same
drilldown level volume 1h 0.01s 0.01s 0.01s same same
drilldown service landing 1h 0.01s 0.01s 0.01s same same
drilldown detected_level 1h 0.02s 0.02s 0.01s same same
json rate by level (no filter, no drop) 1h 400 400 400 same same
logfmt count by level, filter, drop 1h 0.07s 0.07s 0.03s same same
instant ungrouped rate instant 0.01s 0.01s 0.04s same same
instant json volume instant 0.20s 0.10s 0.05s same same
instant json filtered instant 0.17s 0.09s 0.04s same same

Verdict: 20 shape×range — 20 same; results: 0 new difference(s) from loki, 1 pre-existing (also on base).

The two instant shapes (instant json volume, instant json filtered) answer
in half the time of main for the raw-row projection; the row evaluator is
otherwise unchanged by this PR except for the detected_level derivation (own
commit).

Where the split falls back to the row evaluator

A read of more than twice -max-stats-query-series in groups (or a response
too large to read) is answered by the row evaluator, as on main. Host proxies
of both builds with the shown limit against the same stack, warm p50 of 3-5
runs on distinct windows (bench/ab/results/oneoff/2026-10-13-json-error-split-fallback.json):

shape limit range main branch
F1 sum by (session_id) (many groups), fallback 500 1h 400 in 0.02 s 400 in 0.15 s
F1 500 24h 400 in 0.02 s 400 in 4.81 s
F2 sum by (service_name), 7 groups, fallback 3 1h 400 in 0.00 s 400 in 0.07 s
F2 3 24h 400 in 0.00 s 400 in 1.45 s
F4 sum by (detected_level), 11 spellings (12 groups, 5 series), fallback 5 1h 200 in 0.27 s (unknown only) 200 in 0.37 s
F4 5 24h 200 in 0.32 s (unknown only) 200 in 0.46 s
F3 sum by (user_id), within twice the limit, no fallback 500 1h 200 in 1.58 s 200 in 0.07 s
F3 500 24h 502 in 8.47 s 200 in 1.12 s

The fallback is not free, and not "no slower than main". It is one
VictoriaLogs stats scan (which aggregates every group before it answers, so
stopping the read saves the proxy's memory, not VictoriaLogs' time) followed by
exactly main's row evaluator: 0.1 s more at 1 h on 150k lines (F4), and where
main's row evaluator ends at once with the series limit error because the first
rows already exceed the limit (F1, F2), the scan makes the same 400 take 0.07 to
0.15 s at 1 h and 1.5 to 4.8 s at 24 h. Main's pushdown for the shapes it
already served (| json | drop __error__) has the same cost profile for an
over-limit grouping. The memory guard cannot be tighter without turning a
legitimate level-spelling query into a fallback. Not done: a cheap pre-flight
that would send an obviously over-limit grouping straight to the row evaluator.

benchstat, main vs branch, 10 interleaved runs each (BenchmarkOrderedJSON*,
the branch's benchmark file copied to the main tree):

benchmark main branch delta
OrderedJSONLogsVolume (stats pushdown) 8.017 ms 8.019 ms ~ (p=1.000)
OrderedJSONRowEvaluator (row evaluator) 36.95 ms 36.23 ms ~ (p=0.280)

B/op is equal (11.33 MiB, 43.78 MiB); allocs/op differ by under 0.01% (243.8k
and 657.2k).

Backend-safety load test: the numbers below are from the previous head and were
not re-run for this round (the group guard and the fallback changed what a
heavy query does under load; a rerun is owed before merge).

  • branch: 202 x 200, p50 9.9 s (6 h) and 10.5 s (24 h); /labels probe
    56/56 OK, at most 7.3 s; VictoriaLogs restarts 0 -> 0.
  • main (same load): 9 x 200, 23 x 502, 66 x 429; VictoriaLogs restarts
    0 -> 0.

Registry

The rows below are new.

conformance/registry/cases/semantics/json-error-filter-metric-split-pushdown.yaml (new):

id: semantics/json-error-filter-metric-split-pushdown
title: A `| json | __error__=""` metric counts Loki's accepted lines from VictoriaLogs stats, reading only the doubtful lines raw (fixed)
proves:
  - parser-error-and-label-collision
  - loki_api_v1_query_range
consumer: api
why: |
  `sum by (app) (count_over_time({namespace="prod"} | json | __error__="" [5m]))`
  counts only the lines Loki's JSON parser accepts. VictoriaLogs attaches no
  parser error, so the stats pushdown refused any `__error__` filter and every
  such query read all selected lines as raw rows into the row evaluator:
  1.6 s at 1 h (Loki 0.04 s) and a 502 on the row or byte limit at 6-24 h.

  Loki (pkg/logql/log/parser.go:74-135 JSONParser.Process) runs
  grafana/jsonparser ObjectEach over the line and walks a nested object only
  when a required label starts with its key path (parser_hints.go
  ShouldExtractPrefix); with `__error__` required parsing never stops early.
  So whether Loki accepts a line depends on the query, and no single LogsQL
  filter can match its JSONParserErr. The pushdown splits the selected lines
  instead:

  - a line that does not open with `{` after space, tab, line feed or
    carriage return fails ObjectEach (jsonparser nextToken), so Loki drops it;
  - a line VictoriaLogs parses as one JSON object (a sentinel member spliced
    after the brace and read back with unpack_json; the splice cannot repair a
    broken line, while wrapping the line in a new object could be closed by
    trailing text) and that holds none of the constructs fastjson accepts and
    jsonparser rejects (a backslash in a key, a member value starting with
    `. e E +`, NaN or Inf: parseRawNumber/parseValue vs getType) is accepted
    by Loki under every hint set, so VictoriaLogs counts it;
  - every other brace-opened line is counted per bucket in the same scan and
    read as a raw row only from those buckets, projected to the fields the
    row evaluator reads, and evaluated by it.

  The hazard constructs are looked for with a cached `| limit 1` probe; only
  when it finds one does the scan run again with such lines moved to the raw
  rows. The parse-risk probes for parsed labels check only lines
  VictoriaLogs parses. Window sums add the bucket counts and the raw lines at
  each evaluation point before rate is divided once. service_name is the
  stream label Loki assigns from the other stream labels: VictoriaLogs takes
  the first source field that is a stream label of the row (a stream filter
  in `format if`), never structured metadata, as the row evaluator does.

  Series limit: VictoriaLogs groups are not Loki series. It makes a group for
  every row reaching stats (label filters therefore run before the stats
  pipe), groups the spellings of one level apart (info, INFO, inf and
  information are four groups and one detected_level series) and the empty
  service name apart from unknown_service, so no count of groups says how many
  series the answer holds. The split therefore never ends with the series limit
  error from a group count. The lines read as raw rows have the grouped fields
  blanked once `format if (<doubtful line>) "1" as __vlr` has marked them
  (`format if (__vlr:*) "" as <field>`, pipes VictoriaLogs has had since
  v1.40.0): they are counted per bucket whatever their labels, because the row
  evaluator derives those itself, and so they form one group. Only the merged
  answer, after the groups are keyed by their Loki labels and the raw rows are
  added, is checked against `-max-stats-query-series`, with Loki's error. The
  stats read keeps at most twice the limit in groups as a memory guard; a read
  past it, or a response too large to read (`maxStatsBucketResponseBytes`:
  many series over a long range at a fine step), only means the split does
  not answer: the row evaluator does, as it did before the split, with its own
  row and byte limits (`-manual-range-metric-row-limit`,
  `-ordered-json-metric-max-bytes`) and Loki's series limit error where its
  series exceed the limit. The fallback costs the stats scan on top of the row
  evaluator (0.1 s at 1 h; at 24 h 1.5-4.8 s where the row evaluator would
  have ended at once with the series limit error), because VictoriaLogs
  aggregates every group before it answers. Grafana Logs Drilldown requests
  (which keep the busiest series of an over-limit answer) and groupings by a
  field starting with `_` take the row evaluator as before.

  detected_level is Loki's value at ingest
  (semantics/json-metric-detected-level-derivation). The split serves a
  grouping by it only from the stored level fields: the pipes copy the stored
  detected_level and level fields (`copy detected_level as __dl_d, level as
  __dl_l`) before the sentinel splice, and nothing of the split touches the
  copies except the blanking of the lines read as raw rows. It is served when
  every counted group has a stored level and no stored detected_level (the
  spellings of one level are separate groups and one series, merged after the
  read, so the series limit counts series). The derivation chain, its
  presence probe and its witness are never part of a split plan. A window
  holding a counted line the stored fields do not decide (a level only the
  body holds, none at all, a stored detected_level label), a line with another
  stored level field (severity, lvl, the OTLP severity fields: the copy of
  `level` cannot tell a stream label from metadata, and Loki reads the
  stream's before the metadata's, found by a `| limit 1` probe), a read past the
  group guard and a response too large to read leave the query to the row
  evaluator, which derives the level of every line itself, as it does for the
  lines read as raw rows. A filter on detected_level is not split: the filter
  would need the derived level for the raw rows and the stored one for the
  counted lines, so that plan keeps the row evaluator. Speed never outranks
  Loki's answer: every doubtful window takes the row evaluator.

  A step wider than the range leaves gaps between the evaluation windows; the
  scan covers them, but a series none of whose counted buckets falls in a
  window has no point in Loki's answer, so it is dropped before the limit is
  applied.

  Layer: VictoriaLogs native stats (`count() if (-__vlr:* ...)`,
  `count() if (__vlr:*)`); bounded raw rows for the third set.
request:
  method: GET
  path: /loki/api/v1/query_range
  params:
    query: 'sum by (app) (count_over_time({namespace="prod"} | json | __error__="" [5m]))'
    start: now-24h
    end: now
    step: "60"
  headers:
    X-Scope-OrgID: "0"
compare:
  mode: exact
  fields: [status, series_labels, values]
  expect: |
    HTTP 200 with Loki's series and values from one stats_query_range scan
    (two when the hazard probe finds a line) plus raw reads limited to the
    buckets holding brace-opened lines VictoriaLogs cannot vouch for.
    Measured on VictoriaLogs v1.52.0 with generator data: 1.68 s -> 0.06 s at
    1 h (Loki 0.04 s); 502 -> 1.16 s at 24 h.
gap:
  status: fixed
  fixed_by: "#758"
  impact: explore-visible
  effort: M
  area: 'internal/proxy ordered_json_valid_split.go, ordered_json_metric.go stats pushdown'
  loki: 'pkg/logql/log/parser.go:74-135 JSONParser.Process; pkg/logql/log/parser_hints.go:73-188; grafana/jsonparser parser.go ObjectEach/getType'
  proxy: 'every selected line read as a raw row (502 at the row and byte limits at 6-24 h)'
  planned_test: 'TestRangeMetricCompatibilityJSONErrorFilterSplit, ...SplitSeriesLimit and ...SplitDetectedLevel (test/e2e-compat, group semantics: the stored-level, body-level, gap-line and deep-nested variants against Loki); proxy TestJSONValidSplitPredicateDifferential, FuzzJSONValidSplitPredicate, TestJSONLokiRejectHazardTable, TestJSONValidSplitEligibility, TestJSONValidSplitMatchesRawEvaluator, TestJSONValidSplitReadsOnlyRawRowBuckets, TestJSONValidSplitCountsDeepLinesLikeLoki, TestJSONValidSplitFilteredOutGroupsStayUnderSeriesLimit, TestJSONValidSplitRawOnlyGroupIsNotASeries, TestJSONValidSplitServiceNameFromStreamLabelWithNewline, TestJSONValidSplitHazardProbeUsesTheSplitBraceFilter, TestJSONValidSplitHazardProbeCancelsTheFirstScan, TestJSONValidSplitMergedAnswerOverTheLimitReturnsLokiError, TestJSONValidSplitOverTwiceTheLimitGroupsFallBackToRowEvaluator, TestJSONValidSplitLevelSpellingsMergeUnderTheLimit, TestJSONValidSplitLimitPlusOneSeriesWithoutRawRows, TestJSONValidSplitOversizedResponseOnlyFallsBackForSplitPlans, TestJSONValidSplitDrilldownRequestsKeepTheRowEvaluator, TestJSONValidSplitMarksRawCandidatesOnce, TestJSONValidSplitGapGroupsAreNoSeries, TestJSONValidSplitHugeResponseFallsBackWithBoundedMemory, TestJSONValidSplitFilteredOutGroupsUnderSizeCap, TestJSONValidSplitSeriesLimitFailsBeforeRawRows, TestJSONValidSplitReadStopsAtTwiceTheSeriesLimit, TestJSONValidSplitRawCandidatesFormOneGroup, TestJSONValidSplitRawCandidatesOverManyStreamsFormOneGroup, TestJSONValidSplitResponseTooLargeFallsBackToRawEvaluator, TestJSONValidSplitWithoutLabelsSendsNoEmptyUnpack, TestJSONValidSplitDetectedLevelWindowsMatchTheRowEvaluator, TestOrderedJSONRowProjectionKeepsTheStoredLevelFields'
  note: |
    The e2e is green on VictoriaLogs v1.52.0 and v1.47.0. The row evaluator's guards (nesting depth 64,
    1024 fields, 1 MiB line, 64 KiB value) now apply only to the raw rows: a line VictoriaLogs vouches
    for is counted as Loki counts it, however wide and up to 300 levels deep (VictoriaLogs' JSON parser
    limit); a deeper line is read raw and keeps the row evaluator's depth guard. A JSON key with an empty value still merges into the
    label-less series (semantics/json-empty-value-label-series), on this path as on the row evaluator.
  clusters: []

conformance/registry/cases/semantics/json-empty-value-label-series.yaml (new):

id: semantics/json-empty-value-label-series
title: A parsed label with an empty value is its own series in Loki, merged into the label-less series by the proxy (open)
proves:
  - parser-error-and-label-collision
consumer: api
why: |
  Grouped by a key of the JSON body, Loki keeps a line whose key holds an
  empty value (`{"a":""}`, or a value its unescape rejects such as a lone
  surrogate `"\ud800"`, which pkg/logql/log/parser.go readValue turns into
  "") in a series `{a=""}`, apart from the lines without the key. The
  proxy's row evaluator drops empty values when it builds the series
  (orderedJSONMetricPlan.groupLabels), and VictoriaLogs groups a missing and
  an empty field alike, so both land in the label-less series.

  Measured on VictoriaLogs v1.52.0 against Loki v3.7.7 with a crafted
  corpus: `sum by (a) (count_over_time({...} | json | __error__="" [1m]))`
  answered 23 series on Loki and 22 on the proxy (main and this change
  alike); the 6 lines of `{a=""}` were added to `{}`.
request:
  method: GET
  path: /loki/api/v1/query_range
  params:
    query: 'sum by (a) (count_over_time({app="json-empty"} | json | __error__="" [1m]))'
    start: now-10m
    end: now
    step: "60"
  headers:
    X-Scope-OrgID: "0"
  precondition: |
    The stream holds lines `{"a":""}`, `{"a":"x"}` and `{"b":1}`.
compare:
  mode: exact
  fields: [series_labels, values]
  expect: |
    Three series: {a=""}, {a="x"} and {} (not met: {a=""} is merged into {}).
gap:
  status: open
  impact: explore-visible
  effort: M
  area: 'internal/proxy ordered_json_metric.go groupLabels (row evaluator); stats pushdown grouping (VictoriaLogs cannot tell an empty field from a missing one)'
  loki: 'pkg/logql/log/parser.go:137-211 parseLabelValue/readValue; the vector aggregation keeps the empty label'
  proxy: 'empty-valued parsed labels dropped from the series'
  planned_test: 'a row-evaluator unit case and an e2e on a corpus with empty values'
  clusters: []

Changed rows:

diff --git a/conformance/registry/cases/profiles/json-line-stored-without-line.yaml b/conformance/registry/cases/profiles/json-line-stored-without-line.yaml
index dd6fa864..556804b9 100644
--- a/conformance/registry/cases/profiles/json-line-stored-without-line.yaml
+++ b/conformance/registry/cases/profiles/json-line-stored-without-line.yaml
@@ -11,7 +11,9 @@ why: |
   dotted names, numbers as strings) and sets _msg to "missing _msg field;
   see https://docs.victoriametrics.com/victorialogs/keyconcepts/#message-field".
   Key order, value types and nesting are lost, and the fields of the line
-  cannot be told from the push's structured metadata. The proxy rebuilds the
+  cannot be told from the push's structured metadata. Every `| json` metric
+  path (the stats pushdown, its parse-risk probes and the row evaluator)
+  reads the line from _msg, so such rows count as lines that are not JSON. The proxy rebuilds the
   line from every stored field (structured metadata included), reports them
   as structured metadata without a parser and as parsed labels after
   `| json` or `| logfmt`. Loki returns the original line and no labels from
diff --git a/conformance/registry/cases/semantics/pipeline-error-text-parity.yaml b/conformance/registry/cases/semantics/pipeline-error-text-parity.yaml
index bf087d79..93c060ab 100644
--- a/conformance/registry/cases/semantics/pipeline-error-text-parity.yaml
+++ b/conformance/registry/cases/semantics/pipeline-error-text-parity.yaml
@@ -27,8 +27,10 @@ why: |
   Now, for a `| json` metric whose pipeline neither drops `__error__` nor
   carries a label filter an unparsed line fails (and that requires labels,
   so the parser runs), one `| limit 1` lookup of a selected line that is
-  not a JSON object (`-_msg:~"^\s*\{"`, Loki's `jsonparser.ObjectEach`
-  fails every such line) answers the error before any row is scanned, with
+  not a JSON object (`-_msg:~"^[ \t\n\r]*\{"`: Loki's `jsonparser.ObjectEach`
+  skips only space, tab, line feed and carriage return before the brace and
+  fails every other line, one opening with a form feed included) answers the
+  error before any row is scanned, with
   Loki's text and that line's series; the evaluator's own check keeps the
   same text for a malformed object it meets while scanning. Only lines Loki
   evaluates count: the lookup starts one nanosecond after `start - range`

Visual proof and owed proofs

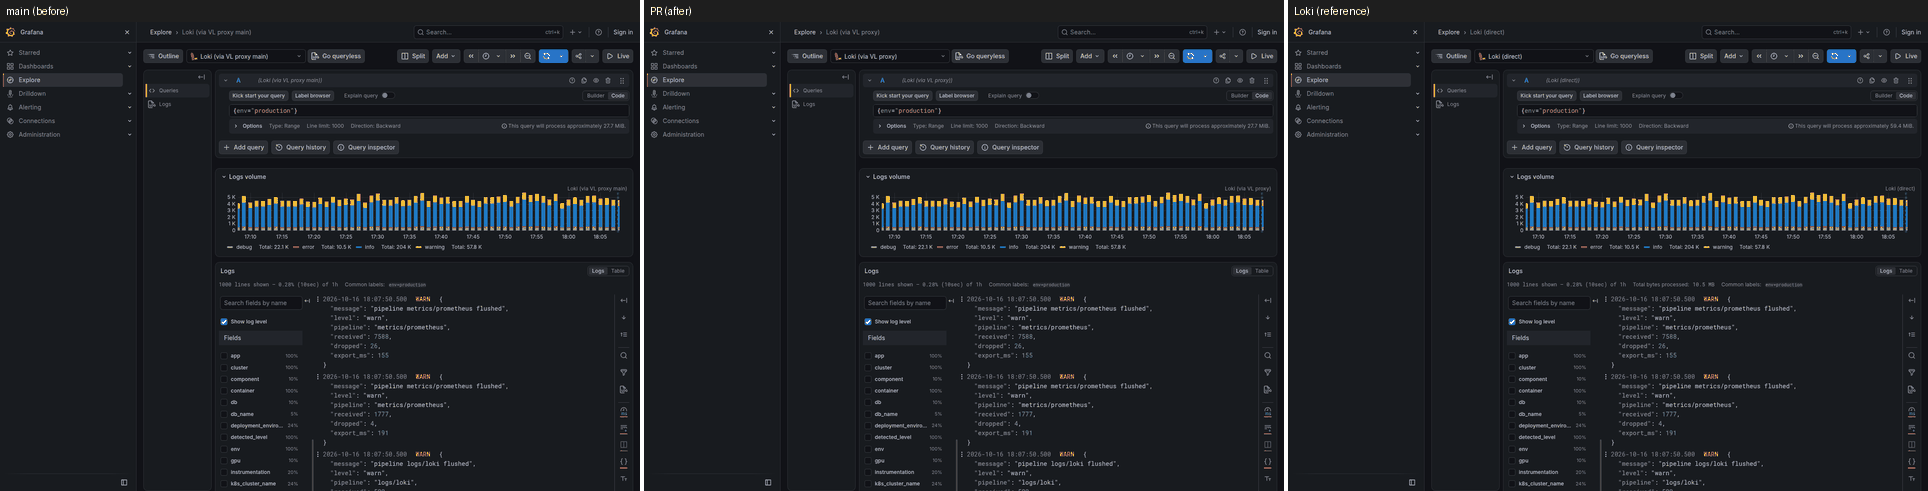
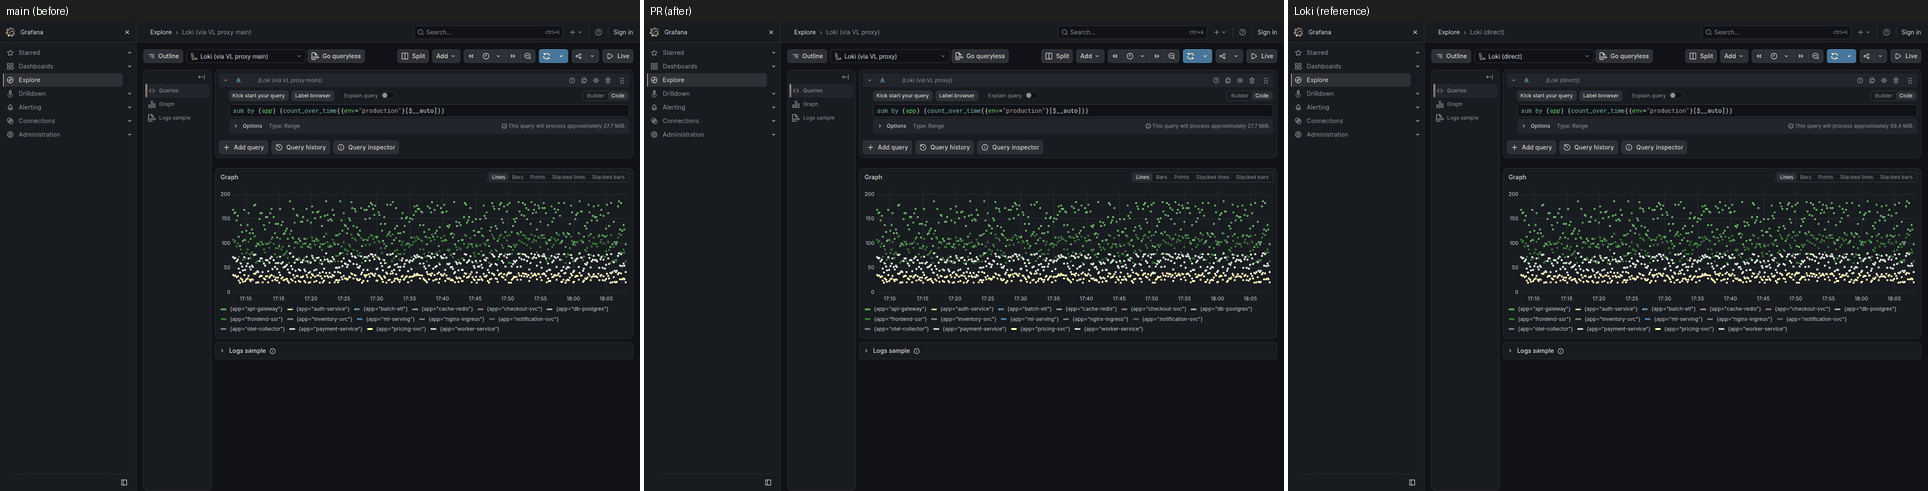
bench/visual/spec.json adds explore-json-error-filter-metric, which lists
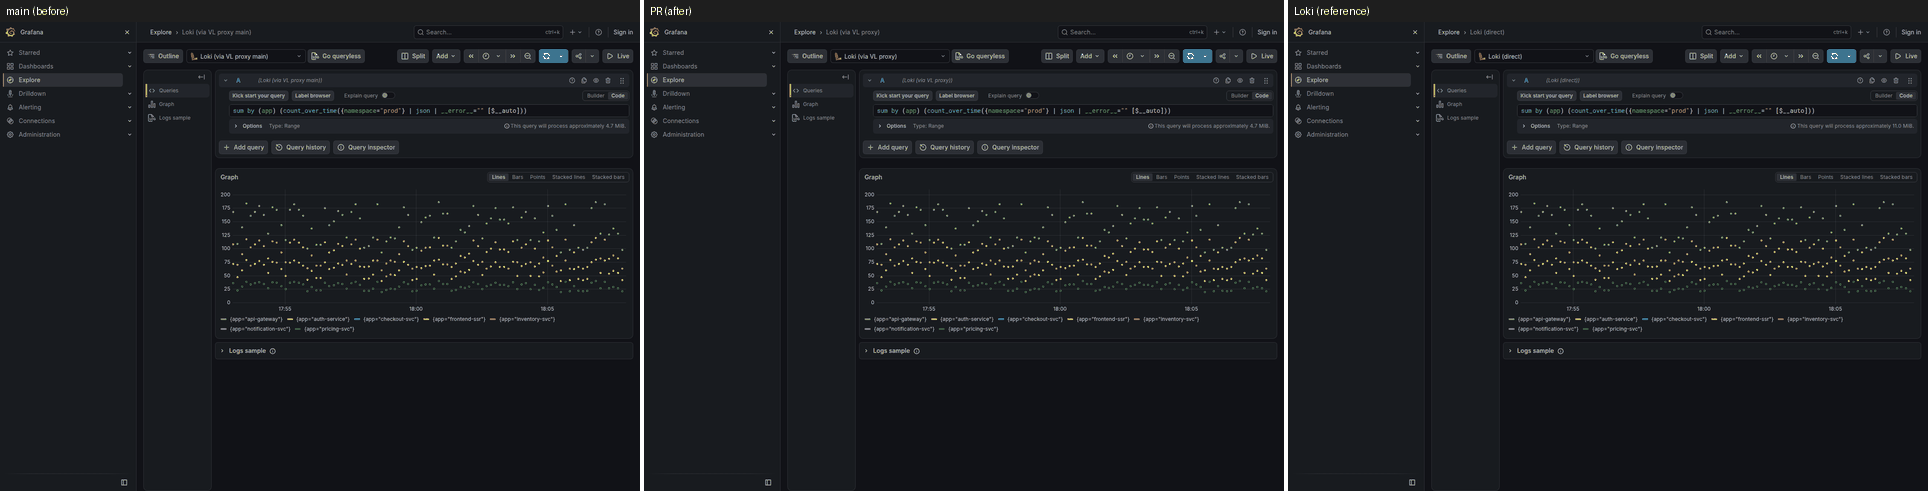
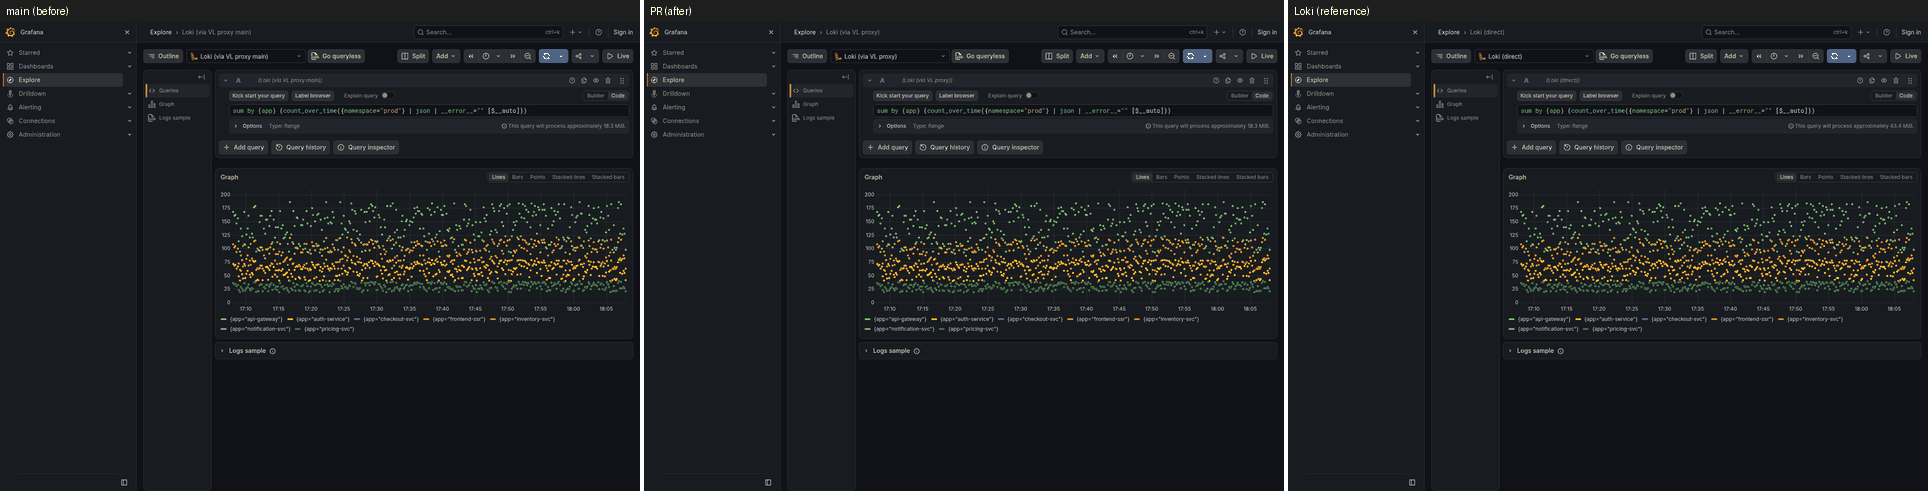
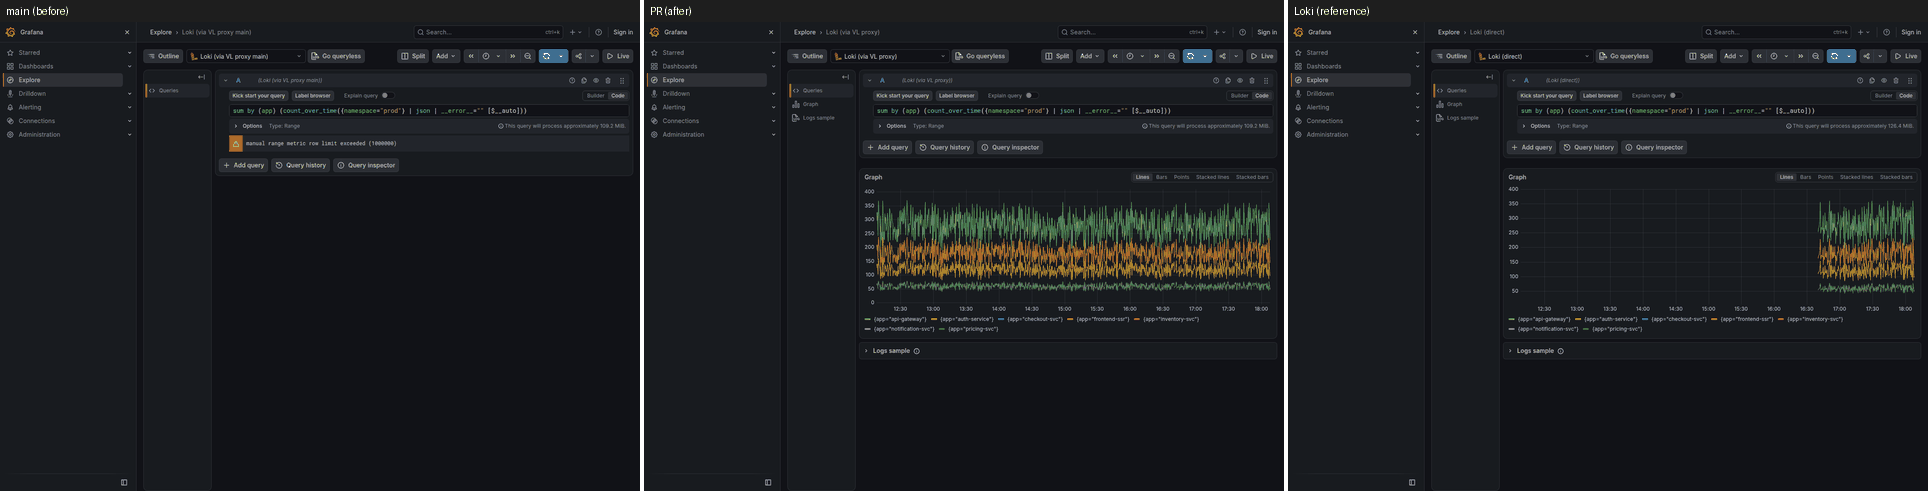
the fixed case semantics/json-error-filter-metric-split-pushdown. The visual-smoke job captures main vs PR vs Loki.

Still owed before merge:

  • the real-Grafana range matrix (5m-7d) through the Grafana datasources;
  • before/after Explore screenshots next to Loki, plus the Fix-proof capture of
    sum by (app) (count_over_time({namespace="prod"} | json | __error__="" [$__auto]))
    at 24 h;
  • the API data-to-data match % and quality score vs Loki, base vs PR.

szibis added a commit that referenced this pull request Oct 12, 2026
@github-actions github-actions Bot added size/XL Extra large change scope/proxy Proxy core scope/ci CI/CD scope/docs Documentation scope/tests Tests performance Performance and removed size/XL Extra large change labels Oct 12, 2026
@github-actions

github-actions Bot commented Oct 12, 2026 •

Copy link
Copy Markdown
Contributor

🟢 Performance A/B: faster, no regression

91 shape×range — 6 🟢 faster · 85 ⚪ same · results vs Loki: 76 same, 0 new difference(s), 15 pre-existing

shape range base p50 PR p50 change Loki p50 PR ÷ Loki result vs Loki
🟢 instant json filtered instant 434 ms 218 ms ¹ 🟢 -50% 72 ms 3.03× ✅ same
🟢 J1 json no-error count by service_name, one service 1h 1.31 s 109 ms ¹ 🟢 -92% 32 ms 3.41× ✅ same
🟢 J2 json no-error count by app, namespace 1h 3.99 s 308 ms ¹ 🟢 -92% 90 ms 3.42× ✅ same
🟢 J3 json no-error count by parsed method 1h 1.30 s 152 ms ¹ 🟢 -88% 29 ms 5.24× ✅ same
🟢 J4 json no-error count by service_name, all services 1h 5.69 s 331 ms ¹ 🟢 -94% 121 ms 2.74× ✅ same
🟢 J5 json no-error bytes_rate by app 1h 4.01 s 291 ms ¹ 🟢 -93% 79 ms 3.68× ✅ same

¹ re-measured with 7 runs, on windows the first pass did not use, after it moved beyond noise.

85 unchanged shape×range (within noise)
shape range base p50 PR p50 change Loki p50 PR ÷ Loki result vs Loki
⚪ bytes_over_time by app 1h 70 ms 70 ms ⚪ +0% 85 ms 0.82× ✅ same
⚪ drilldown service landing 1h 35 ms 31 ms ⚪ -11% 25 ms 1.24× ✅ same
⚪ instant json volume instant 504 ms 501 ms ⚪ -1% 100 ms 5.01× ✅ same
⚪ instant ungrouped rate instant 7 ms 6 ms ⚪ -14% 74 ms 0.08× ✅ same
⚪ json rate by level (no filter, no drop) 1h 400 400 ⚪ +0% 400 — ✅ same
⚪ json volume no filters 1h 199 ms 199 ms ⚪ +0% 3 ms 66× ✅ same
⚪ logfmt count by level, filter, drop 1h 450 ms 456 ms ⚪ +1% 53 ms 8.60× ✅ same
⚪ logfmt volume 1h 302 ms 299 ms ⚪ -1% 55 ms 5.44× ✅ same
⚪ logs plain 1h 63 ms 67 ms ⚪ +6% 36 ms 1.86× ✅ same
⚪ logs | json 1h 93 ms 105 ms ⚪ +13% 57 ms 1.84× ✅ same
⚪ logs | logfmt 1h 151 ms 153 ms ⚪ +1% 45 ms 3.40× ✅ same
⚪ stream-label count by app 1h 29 ms 25 ms ⚪ -14% 36 ms 0.69× ✅ same
⚪ topk rate by app 1h 46 ms 44 ms ⚪ -4% 84 ms 0.52× ➖ differs (as base)
⚪ ungrouped rate 1h 11 ms 10 ms ⚪ -9% 82 ms 0.12× ✅ same
⚪ DB3 json field breakdown user_id 1h 52 ms 48 ms ⚪ -8% 25 ms 1.92× ✅ same
⚪ DB4 json field breakdown batch_id 1h 102 ms 100 ms ⚪ -2% 64 ms 1.56× ✅ same
⚪ X1 json filter level_extracted, by level 1h 392 ms 395 ms ⚪ +1% 41 ms 9.63× ✅ same
⚪ X2 json group by level_extracted 1h 310 ms 324 ms ⚪ +5% 44 ms 7.36× ✅ same
⚪ X3 json rate, level_extracted equality 1h 297 ms 279 ms ⚪ -6% 33 ms 8.45× ✅ same
⚪ X4 json bytes, level_extracted regexp 1h 402 ms 400 ms ⚪ -0% 90 ms 4.44× ✅ same
⚪ X5 logfmt filter level_extracted, by level 1h 693 ms 679 ms ⚪ -2% 51 ms 13× ✅ same
⚪ E1 logs, json parser over stream labels 1h 121 ms 119 ms ⚪ -2% 64 ms 1.86× ✅ same
⚪ E2 logs, logfmt parser over stream labels 1h 72 ms 71 ms ⚪ -1% 51 ms 1.39× ✅ same
⚪ E3 logs, json, existence filter on level_extracted 1h 141 ms 140 ms ⚪ -1% 73 ms 1.92× ✅ same
⚪ E4 logs, logfmt, existence filter on level_extracted 1h 95 ms 95 ms ⚪ +0% 54 ms 1.76× ✅ same
⚪ E5 logs, json, drop level_extracted 1h 118 ms 114 ms ⚪ -3% 62 ms 1.84× ✅ same
⚪ E6 logfmt count by level_extracted 1h 50 ms 45 ms ⚪ -10% 7 ms 6.43× ✅ same
⚪ E7 json count by level_extracted 1h 150 ms 149 ms ⚪ -1% 13 ms 11× ✅ same
⚪ E8 instant logfmt by level_extracted instant 7 ms 6 ms ⚪ -14% 10 ms 0.60× ✅ same
⚪ A explore volume, 2 filters, drop 1h 154 ms 155 ms ⚪ +1% 99 ms 1.57× ✅ same
⚪ B grouped sum, filter, no drop 1h 108 ms 103 ms ⚪ -5% 33 ms 3.12× ✅ same
⚪ C ungrouped sum, filter, no drop 1h 108 ms 103 ms ⚪ -5% 32 ms 3.22× ✅ same
⚪ D volume, no filters 1h 225 ms 228 ms ⚪ +1% 43 ms 5.30× ✅ same
⚪ E field breakdown pipeline (explore) 1h 102 ms 104 ms ⚪ +2% 34 ms 3.06× ✅ same
⚪ F field breakdown service_version (explore) 1h 150 ms 141 ms ⚪ -6% 41 ms 3.44× ✅ same
⚪ G field breakdown pipeline (drilldown) 1h 44 ms 47 ms ⚪ +7% 23 ms 2.04× ✅ same
⚪ H field breakdown service_version (drilldown) 1h 93 ms 84 ms ⚪ -10% 25 ms 3.36× ✅ same
⚪ I grafana volume of B 1h 107 ms 99 ms ⚪ -7% 33 ms 3.00× ✅ same
⚪ O2 explore log volume (Grafana form), underscore structured-metadata filter 1h 71 ms 69 ms ⚪ -3% 33 ms 2.09× ✅ same
⚪ DL1 drilldown field breakdown json-expr, level filter 1h 504 ms 502 ms ⚪ -0% 22 ms 23× ✅ same
⚪ DL2 drilldown field breakdown, level + stream-label filter before json 1h 51 ms 48 ms ⚪ -6% 7 ms 6.86× ✅ same
⚪ DL3 drilldown logfmt field breakdown, level filter 1h 657 ms 612 ms ⚪ -7% 115 ms 5.32× ➖ differs (as base)
⚪ DL4 instant count, level filter, json+logfmt, 1h instant 529 ms 515 ms ⚪ -3% 1.26 s 0.41× ✅ sum ±0.27%
⚪ DL6 explore volume, level filter before json 1h 581 ms 551 ms ⚪ -5% 36 ms 15× ✅ sum ±0.27%
⚪ A1 nginx include GET, log query 1h 16 ms 17 ms ⚪ +6% 11 ms 1.55× ✅ same
⚪ A2 nginx exclude GET, log query 1h 15 ms 16 ms ⚪ +7% 10 ms 1.60× ✅ same
⚪ A3 nginx include GET, count_over_time 1h 14 ms 14 ms ⚪ +0% 6 ms 2.33× ✅ same
⚪ A4 nginx exclude GET, count_over_time 1h 18 ms 18 ms ⚪ +0% 6 ms 3.00× ✅ same
⚪ A5 drilldown exclude, volume by detected_level 1h 26 ms 25 ms ⚪ -4% 5 ms 5.00× ✅ same
⚪ A6 nginx include ends on a literal, log query 1h 13 ms 13 ms ⚪ +0% 4 ms 3.25× ✅ same
⚪ A7 nginx exclude ends on a literal, log query 1h 17 ms 16 ms ⚪ -6% 10 ms 1.60× ✅ same
⚪ A8 nginx include two literals, count_over_time 1h 22 ms 28 ms ⚪ +27% 6 ms 4.67× ✅ same
⚪ A9 nginx include two literals, ends on a literal, count_over_time 1h 20 ms 21 ms ⚪ +5% 5 ms 4.20× ✅ same
⚪ P1 logs, json, level equals 1h 128 ms 128 ms ⚪ +0% 65 ms 1.97× ✅ same
⚪ P2 logs, logfmt, level not equal 1h 31 ms 32 ms ⚪ +3% 5 ms 6.40× ✅ same
⚪ P3 logs, json, level existence 1h 126 ms 133 ms ⚪ +6% 74 ms 1.80× ✅ same
⚪ P4 logfmt count by level 1h 31 ms 32 ms ⚪ +3% 6 ms 5.33× ✅ same
⚪ P5 json count by level 1h 87 ms 82 ms ⚪ -6% 14 ms 5.86× ✅ same
⚪ P6 json count, level filter 1h 15 ms 17 ms ⚪ +13% 12 ms 1.42× ✅ same
⚪ P7 json rate by level, level regexp 1h 16 ms 20 ms ⚪ +25% 14 ms 1.43× ✅ same
⚪ P8 json count by a name that is no stream label 1h 85 ms 92 ms ⚪ +8% 12 ms 7.67× ✅ same
⚪ P9 instant logfmt by level instant 5 ms 8 ms ⚪ +60% 9 ms 0.89× ✅ same
⚪ E1 json duration_ms sum by service 1h 86 ms 86 ms ⚪ +0% 14 ms 6.14× ➖ differs (as base)
⚪ E2 json duration_ms p95 by service 1h 430 ms 422 ms ⚪ -2% 14 ms 30× ✅ same
⚪ E3 logfmt latency_ms rate, production 1h 502 ms 507 ms ⚪ +1% 134 ms 3.78× ➖ differs (as base)
⚪ E4 logfmt size_bytes max by service 1h 47 ms 55 ms ⚪ +17% 15 ms 3.67× ➖ differs (as base)
⚪ E5 json duration_ms sum, instant instant 35 ms 38 ms ⚪ +9% 28 ms 1.36× ✅ same
⚪ E6 logfmt ttl unit string (Loki 400) 1h 400 400 ⚪ +2% 400 — ✅ same
⚪ E7 json hexadecimal trace_id (Loki 400) 1h 400 400 ⚪ +3% 400 — ✅ same
⚪ E8 json duration_ms sum by service, namespace prod 1h 190 ms 193 ms ⚪ +2% 83 ms 2.33× ➖ differs (as base)
⚪ E9 logfmt latency_ms sum by service, namespace prod 1h 314 ms 314 ms ⚪ +0% 89 ms 3.53× ➖ differs (as base)
⚪ U1 json duration_ms sum by service 1h 96 ms 87 ms ⚪ -9% 14 ms 6.21× ➖ differs (as base)
⚪ U10 instant sum_over_time unwrap instant 36 ms 33 ms ⚪ -8% 27 ms 1.22× ✅ same
⚪ U11 instant max_over_time missing label instant 4 ms 5 ms ⚪ +25% 14 ms 0.36× ✅ same
⚪ U12 json duration_ms over every service 1h 243 ms 252 ms ⚪ +4% 39 ms 6.46× ➖ differs (as base)
⚪ U13 logfmt latency_ms over every service 1h 516 ms 501 ms ⚪ -3% 56 ms 8.95× ➖ differs (as base)
⚪ U14 duration() of a unit string 1h 46 ms 45 ms ⚪ -2% 7 ms 6.43× ➖ differs (as base)
⚪ U2 json duration_ms max by service 1h 95 ms 94 ms ⚪ -1% 35 ms 2.69× ➖ differs (as base)
⚪ U3 json duration_ms sliding sum 1h 87 ms 84 ms ⚪ -3% 31 ms 2.71× ➖ differs (as base)
⚪ U4 logfmt size_bytes sum by service 1h 55 ms 41 ms ⚪ -25% 6 ms 6.83× ➖ differs (as base)
⚪ U5 logfmt ttl unit string (no sample) 1h 38 ms 39 ms ⚪ +3% 6 ms 6.50× ✅ same
⚪ U6 missing label, no parser 1h 18 ms 18 ms ⚪ +0% 9 ms 2.00× ✅ same
⚪ U7 missing label, ungrouped sum 1h 16 ms 17 ms ⚪ +6% 9 ms 1.89× ✅ same
⚪ U8 rate of an unwrapped label 1h 88 ms 88 ms ⚪ +0% 16 ms 5.50× ✅ same
⚪ U9 bytes() conversion 1h 53 ms 53 ms ⚪ +0% 12 ms 4.42× ➖ differs (as base)
Cold (first-run) timings — what a user opening a panel sees
shape range base cold PR cold Loki cold PR ÷ Loki cold
instant json filtered instant 428 ms 205 ms 74 ms 2.77×
J1 json no-error count by service_name, one service 1h 1.34 s 108 ms 32 ms 3.38×
J2 json no-error count by app, namespace 1h 4.00 s 303 ms 90 ms 3.37×
J3 json no-error count by parsed method 1h 1.34 s 160 ms 29 ms 5.52×
J4 json no-error count by service_name, all services 1h 5.67 s 330 ms 187 ms 1.76×
J5 json no-error bytes_rate by app 1h 4.00 s 281 ms 79 ms 3.56×
bytes_over_time by app 1h 70 ms 71 ms 793 ms 0.09×
drilldown service landing 1h 31 ms 35 ms 762 ms 0.05×
instant json volume instant 512 ms 509 ms 96 ms 5.30×
instant ungrouped rate instant 5 ms 8 ms 72 ms 0.11×
json rate by level (no filter, no drop) 1h 400 400 400 —
json volume no filters 1h 206 ms 208 ms 3 ms 69.33×
logfmt count by level, filter, drop 1h 451 ms 458 ms 1.35 s 0.34×
logfmt volume 1h 307 ms 234 ms 1.46 s 0.16×
logs plain 1h 91 ms 68 ms 37 ms 1.84×
logs | json 1h 103 ms 111 ms 60 ms 1.85×
logs | logfmt 1h 158 ms 166 ms 50 ms 3.32×
stream-label count by app 1h 26 ms 24 ms 800 ms 0.03×
topk rate by app 1h 45 ms 47 ms 892 ms 0.05×
ungrouped rate 1h 16 ms 11 ms 753 ms 0.01×
DB3 json field breakdown user_id 1h 68 ms 50 ms 762 ms 0.07×
DB4 json field breakdown batch_id 1h 105 ms 93 ms 780 ms 0.12×
X1 json filter level_extracted, by level 1h 3.69 s 3.97 s 877 ms 4.52×
X2 json group by level_extracted 1h 315 ms 308 ms 1.05 s 0.29×
X3 json rate, level_extracted equality 1h 281 ms 276 ms 663 ms 0.42×
X4 json bytes, level_extracted regexp 1h 410 ms 407 ms 925 ms 0.44×
X5 logfmt filter level_extracted, by level 1h 685 ms 674 ms 1.12 s 0.60×
E1 logs, json parser over stream labels 1h 149 ms 120 ms 66 ms 1.82×
E2 logs, logfmt parser over stream labels 1h 66 ms 72 ms 51 ms 1.41×
E3 logs, json, existence filter on level_extracted 1h 142 ms 153 ms 67 ms 2.28×
E4 logs, logfmt, existence filter on level_extracted 1h 98 ms 127 ms 56 ms 2.27×
E5 logs, json, drop level_extracted 1h 118 ms 118 ms 62 ms 1.90×
E6 logfmt count by level_extracted 1h 45 ms 45 ms 52 ms 0.87×
E7 json count by level_extracted 1h 1.42 s 1.68 s 215 ms 7.80×
E8 instant logfmt by level_extracted instant 7 ms 10 ms 10 ms 1.00×
A explore volume, 2 filters, drop 1h 2.95 s 1.76 s 1.31 s 1.34×
B grouped sum, filter, no drop 1h 126 ms 125 ms 677 ms 0.18×
C ungrouped sum, filter, no drop 1h 131 ms 119 ms 787 ms 0.15×
D volume, no filters 1h 223 ms 214 ms 929 ms 0.23×
E field breakdown pipeline (explore) 1h 109 ms 107 ms 781 ms 0.14×
F field breakdown service_version (explore) 1h 1.38 s 1.36 s 777 ms 1.75×
G field breakdown pipeline (drilldown) 1h 48 ms 44 ms 669 ms 0.07×
H field breakdown service_version (drilldown) 1h 134 ms 134 ms 839 ms 0.16×
I grafana volume of B 1h 126 ms 109 ms 669 ms 0.16×
O2 explore log volume (Grafana form), underscore structured-metadata filter 1h 174 ms 157 ms 662 ms 0.24×
DL1 drilldown field breakdown json-expr, level filter 1h 512 ms 499 ms 584 ms 0.85×
DL2 drilldown field breakdown, level + stream-label filter before json 1h 89 ms 83 ms 31 ms 2.68×
DL3 drilldown logfmt field breakdown, level filter 1h 637 ms 626 ms 1.26 s 0.49×
DL4 instant count, level filter, json+logfmt, 1h instant 696 ms 522 ms 1.34 s 0.39×
DL6 explore volume, level filter before json 1h 1.10 s 1.06 s 774 ms 1.37×
A1 nginx include GET, log query 1h 38 ms 17 ms 14 ms 1.21×
A2 nginx exclude GET, log query 1h 16 ms 17 ms 15 ms 1.13×
A3 nginx include GET, count_over_time 1h 16 ms 14 ms 35 ms 0.40×
A4 nginx exclude GET, count_over_time 1h 19 ms 18 ms 63 ms 0.29×
A5 drilldown exclude, volume by detected_level 1h 40 ms 39 ms 33 ms 1.18×
A6 nginx include ends on a literal, log query 1h 13 ms 13 ms 25 ms 0.52×
A7 nginx exclude ends on a literal, log query 1h 17 ms 18 ms 12 ms 1.50×
A8 nginx include two literals, count_over_time 1h 22 ms 24 ms 31 ms 0.77×
A9 nginx include two literals, ends on a literal, count_over_time 1h 21 ms 20 ms 26 ms 0.77×
P1 logs, json, level equals 1h 159 ms 140 ms 89 ms 1.57×
P2 logs, logfmt, level not equal 1h 30 ms 30 ms 44 ms 0.68×
P3 logs, json, level existence 1h 129 ms 120 ms 71 ms 1.69×
P4 logfmt count by level 1h 42 ms 34 ms 52 ms 0.65×
P5 json count by level 1h 98 ms 97 ms 198 ms 0.49×
P6 json count, level filter 1h 15 ms 14 ms 187 ms 0.07×
P7 json rate by level, level regexp 1h 16 ms 16 ms 212 ms 0.08×
P8 json count by a name that is no stream label 1h 103 ms 102 ms 166 ms 0.61×
P9 instant logfmt by level instant 5 ms 5 ms 9 ms 0.56×
E1 json duration_ms sum by service 1h 106 ms 85 ms 290 ms 0.29×
E2 json duration_ms p95 by service 1h 431 ms 420 ms 250 ms 1.68×
E3 logfmt latency_ms rate, production 1h 510 ms 506 ms 1.24 s 0.41×
E4 logfmt size_bytes max by service 1h 47 ms 46 ms 213 ms 0.22×
E5 json duration_ms sum, instant instant 37 ms 51 ms 28 ms 1.82×
E6 logfmt ttl unit string (Loki 400) 1h 400 400 400 —
E7 json hexadecimal trace_id (Loki 400) 1h 400 400 400 —
E8 json duration_ms sum by service, namespace prod 1h 213 ms 198 ms 770 ms 0.26×
E9 logfmt latency_ms sum by service, namespace prod 1h 325 ms 307 ms 816 ms 0.38×
U1 json duration_ms sum by service 1h 103 ms 85 ms 221 ms 0.38×
U10 instant sum_over_time unwrap instant 37 ms 35 ms 27 ms 1.30×
U11 instant max_over_time missing label instant 5 ms 5 ms 15 ms 0.33×
U12 json duration_ms over every service 1h 238 ms 240 ms 808 ms 0.30×
U13 logfmt latency_ms over every service 1h 496 ms 495 ms 1.30 s 0.38×
U14 duration() of a unit string 1h 45 ms 48 ms 56 ms 0.86×
U2 json duration_ms max by service 1h 96 ms 95 ms 959 ms 0.10×
U3 json duration_ms sliding sum 1h 87 ms 82 ms 254 ms 0.32×
U4 logfmt size_bytes sum by service 1h 51 ms 40 ms 54 ms 0.74×
U5 logfmt ttl unit string (no sample) 1h 40 ms 39 ms 52 ms 0.75×
U6 missing label, no parser 1h 18 ms 18 ms 91 ms 0.20×
U7 missing label, ungrouped sum 1h 16 ms 16 ms 86 ms 0.19×
U8 rate of an unwrapped label 1h 90 ms 91 ms 245 ms 0.37×
U9 bytes() conversion 1h 53 ms 53 ms 111 ms 0.48×
Why these shapes
  • internal/proxy/ordered_json_metric.go → 78: control/bytes_over_time by app, control/instant json filtered, control/instant json volume, control/json rate by level (no filter, no drop), control/json volume no filters, control/logfmt count by level, filter, drop, control/logfmt volume, control/logs | json …
  • internal/proxy/range_metric_compat.go → 21: control/bytes_over_time by app, control/instant json volume, control/instant ungrouped rate, control/json volume no filters, control/stream-label count by app, control/topk rate by app, control/ungrouped rate, json-filter-pushdown/A explore volume, 2 filters, drop …
  • control smoke → 8: control/drilldown service landing, control/instant ungrouped rate, control/json rate by level (no filter, no drop), control/json volume no filters, control/logs plain, control/logs | json, control/stream-label count by app, control/topk rate by app
  • shape added or edited → 5: json-error-split/J1 json no-error count by service_name, one service, json-error-split/J2 json no-error count by app, namespace, json-error-split/J3 json no-error count by parsed method, json-error-split/J4 json no-error count by service_name, all services, json-error-split/J5 json no-error bytes_rate by app

base d12a062c75 → PR a04143d123 · 4 runs (first is cold), warm p50 · ranges 1h · noise ±30% and 100 ms · VictoriaLogs restarts 0→0 · 13.6 min. Same runner, one fresh stack, targets interleaved per request. How to read and reproduce: bench/ab/README.md.

@github-actions

github-actions Bot commented Oct 12, 2026 •

Copy link
Copy Markdown
Contributor

PR Quality Report

Compared against base branch main.

Coverage and tests

Signal Base PR Delta
Test count 10321 10508 187
Coverage 87.9% 88.1% +0.2% (improved)

Compatibility

Track Base PR Delta
Loki API 100.0% 11/11 (100.0%) 0.0% (stable)
Logs Drilldown 100.0% 17/17 (100.0%) 0.0% (stable)
VictoriaLogs 100.0% 11/11 (100.0%) 0.0% (stable)

Performance smoke

Lower CPU cost (ns/op) is better. Lower benchmark memory cost (B/op, allocs/op) is better. Higher throughput is better. Lower load-test memory growth is better. Benchmark rows are medians from repeated samples.

Signal Base PR Delta
QueryRange cache-hit CPU cost 3373.0 ns/op 3370.0 ns/op -0.1% (stable)
QueryRange cache-hit memory 1240.0 B/op 1240.0 B/op 0.0% (stable)
QueryRange cache-hit allocations 27.0 allocs/op 27.0 allocs/op 0.0% (stable)
QueryRange cache-bypass CPU cost 4071.0 ns/op 4092.0 ns/op +0.5% (stable)
QueryRange cache-bypass memory 1301.0 B/op 1304.0 B/op +0.2% (stable)
QueryRange cache-bypass allocations 27.0 allocs/op 27.0 allocs/op 0.0% (stable)
Labels cache-hit CPU cost 924.5 ns/op 916.0 ns/op -0.9% (stable)
Labels cache-hit memory 48.0 B/op 48.0 B/op 0.0% (stable)
Labels cache-hit allocations 3.0 allocs/op 3.0 allocs/op 0.0% (stable)
Labels cache-bypass CPU cost 1501.0 ns/op 1507.0 ns/op +0.4% (stable)
Labels cache-bypass memory 399.0 B/op 399.0 B/op 0.0% (stable)
Labels cache-bypass allocations 14.0 allocs/op 14.0 allocs/op 0.0% (stable)

State

  • Coverage, compatibility, and sampled performance are reported here from the same PR workflow.
  • This is a delta report, not a release gate by itself. Required checks still decide merge safety.
  • Performance is a smoke comparison, not a full benchmark lab run.
  • Delta states use the same noise guards as the quality gate (percent + absolute + low-baseline checks), so report labels match merge-gate behavior.

@github-actions

github-actions Bot commented Oct 12, 2026 •

Copy link
Copy Markdown
Contributor

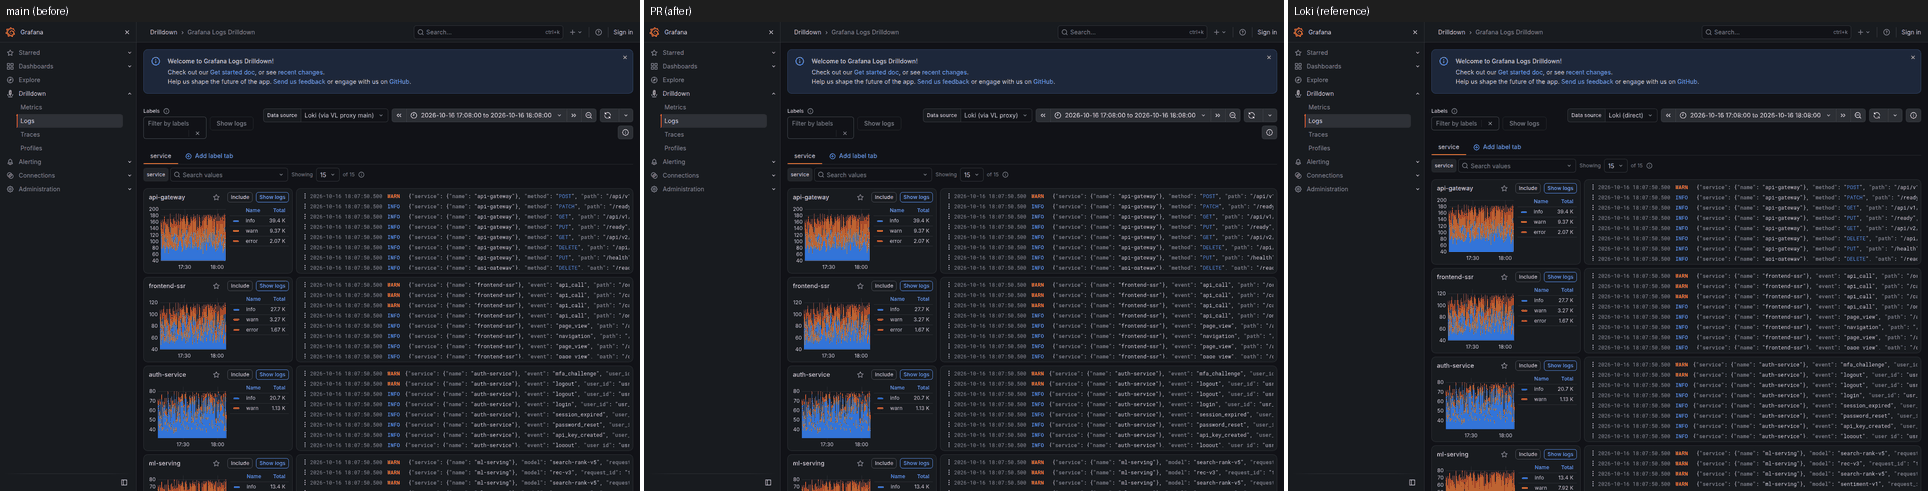
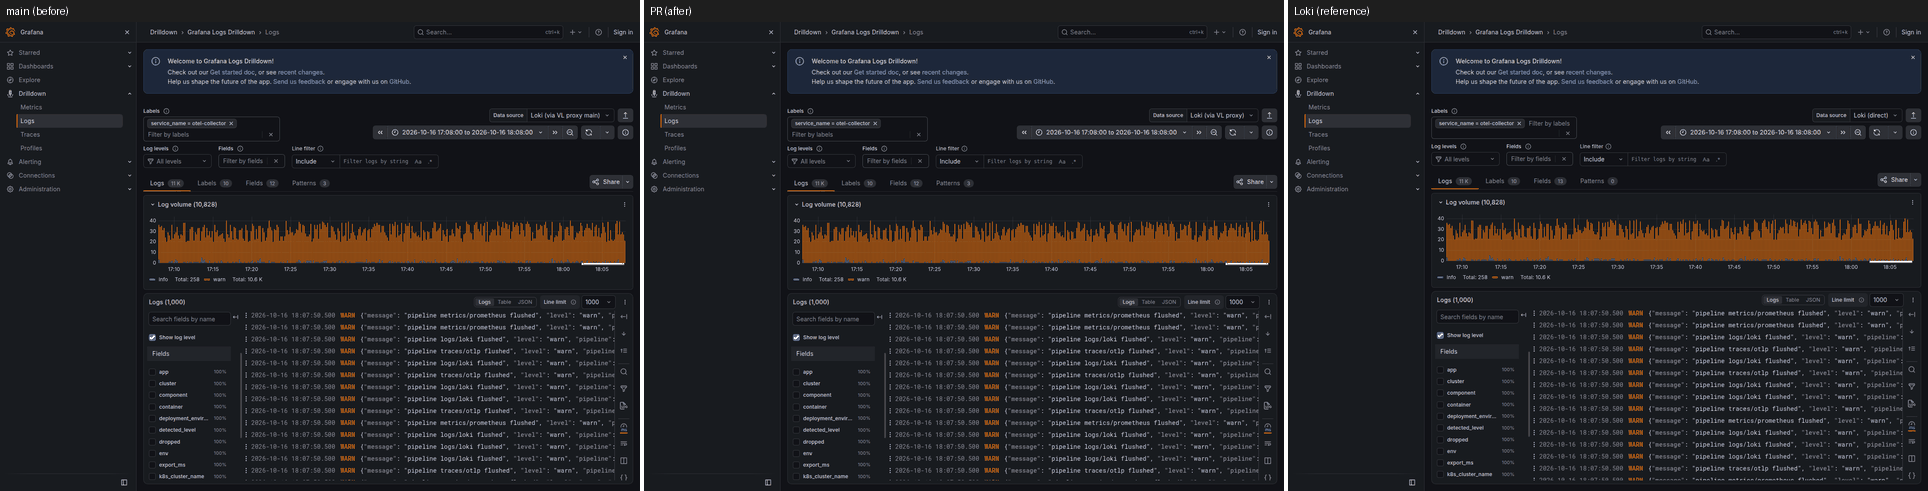
✅ Visual smoke: passed with warnings

Base d12a062c75 vs PR a5ba251ce4, Grafana through the proxy builds and Loki on one fresh stack; run.
Loaded again, once and more patiently, after a first-pass difference or an unsettled page: explore-json-error-filter-metric 6h.
Core set: 5 capture(s) at 1h. Detailed set: 23 entries (explore-json-error-filter-metric, explore-metric-plain, explore-A, explore-B, explore-C, explore-E, explore-F, explore-logs-json, ...). 31 capture(s), 15m/1h/6h, 24h and 7d stay out of PR runs.
Trimmed to the 1h range for the capture budget: explore-A, explore-B, explore-C, explore-E, explore-F, explore-logs-json, explore-logfmt-metric, explore-logs-extracted, explore-extracted-metric, explore-extracted-filter-metric, explore-extracted-group-metric, explore-logs-plain-level, explore-plain-level-metric, explore-unwrap-sum, explore-unwrap-unit-string, explore-unwrap-missing-label, explore-unwrap-conversion-error, explore-pattern-filter-anchored, dd-field-service_version, dd-field-pipeline.

Fix proof

Captures of the exact cases this pull request adds or fixes (registry case, base | PR | Loki). The verdict compares the PR with Loki where the base did not match. The gate fails a case unless one capture is fixed or improved, or, beyond the Loki data window, the base failed where Loki and the PR both answered with data (the label does not excuse it; only visual: none on the case does).

semantics/json-error-filter-metric-split-pushdown: ✅ base failed

page range base = PR (data) vs Loki (PR) verdict
explore-json-error-filter-metric 15m identical identical (1 explained) ⚠️ not reproduced on base
explore-json-error-filter-metric 1h identical identical (1 explained) ⚠️ not reproduced on base
explore-json-error-filter-metric 6h differs (1) n/a (beyond the Loki window) ✅ base failed
explore-json-error-filter-metric-15m: not reproduced on base

explore-json-error-filter-metric-15m

explore-json-error-filter-metric-1h: not reproduced on base

explore-json-error-filter-metric-1h

explore-json-error-filter-metric-6h: base failed

explore-json-error-filter-metric-6h

Regression check

page range set base = PR (data) vs Loki (PR) pixel diff result
dd-fields 1h core ✅ identical identical (4 explained, 1 history-dependent) 0.11% ✅
dd-landing 1h core ✅ identical identical (3 explained) 0.13% ✅
dd-service-logs 1h core ✅ identical identical (3 explained, 1 history-dependent) 0.11% ✅
explore-logs-plain 1h core ✅ identical identical (1 explained) 0.07% ✅
explore-metric-plain 1h core ✅ identical identical (1 explained) 0.04% ✅
dd-field-pipeline 1h detailed ✅ identical identical (3 explained, 1 history-dependent) 0.11% ✅
dd-field-service_version 1h detailed ✅ identical identical (3 explained, 1 history-dependent) 0.11% ✅
explore-A 1h detailed ✅ identical identical (1 explained) 0.04% ✅
explore-B 1h detailed ✅ identical identical (1 explained) 0.04% ✅
explore-C 1h detailed ✅ identical identical (1 explained) 0.04% ✅
explore-E 1h detailed ✅ identical identical (1 explained) 0.04% ✅
explore-F 1h detailed ✅ identical identical (1 explained) 0.04% ✅
explore-extracted-filter-metric 1h detailed ✅ identical identical (1 explained) 0.04% ✅
explore-extracted-group-metric 1h detailed ✅ identical identical (1 explained) 0.04% ✅
explore-extracted-metric 1h detailed ✅ identical identical (1 explained) 0.04% ✅
explore-json-error-filter-metric 15m detailed ✅ identical identical (1 explained) 0.04% ✅
explore-json-error-filter-metric 1h detailed ✅ identical identical (1 explained) 0.04% ✅
explore-json-error-filter-metric 6h detailed differs (1): query ('sum by (app) (count_over_time({namespace="prod"} | j n/a (beyond the Loki window) 7.28% ✅ improved (closer to Loki)
explore-logfmt-metric 1h detailed ✅ identical identical (1 explained) 0.04% ✅
explore-logs-extracted 1h detailed ✅ identical identical (1 explained) 0.07% ✅
explore-logs-json 1h detailed ✅ identical identical (1 explained) 0.07% ✅
explore-logs-plain-level 1h detailed ✅ identical identical (2 explained) 0.07% ✅
explore-metric-plain 15m detailed ✅ identical identical (1 explained) 0.04% ✅
explore-metric-plain 6h detailed ✅ identical n/a (beyond the Loki window) 0.04% ✅
explore-pattern-filter-anchored 1h detailed ✅ identical identical (1 explained) 0.07% ✅
explore-plain-level-metric 1h detailed ✅ identical identical (1 explained) 0.04% ✅
explore-unwrap-conversion-error 1h detailed ✅ identical identical (1 explained) 0.04% ✅
explore-unwrap-missing-label 1h detailed ✅ identical identical (1 explained) 0.04% ✅
explore-unwrap-sum 1h detailed ✅ identical 1 difference(s), 1 on base too; 1 explained 0.04% ✅
explore-unwrap-unit-string 1h detailed ✅ identical identical (1 explained) 0.04% ✅
tail-json-filter live detailed ✅ identical entries in the window: PR 1829, Loki 633, in both 633 6.23% ✅

Gate: a base-vs-PR data difference passes when the PR is closer to Loki, and fails when the PR diverges from Loki or Loki cannot decide it (at a range Loki does not hold, a difference passes when the same page proved it closer to Loki at a shorter range; otherwise label the pull request visual-change-expected to accept an intended change). Also failing: a panel empty on the PR but not on the base, an error banner, panel error, error answer or new "No data" panel on the PR, a PR side that never settled, a difference that did not reproduce on the recapture. Pixel differences only warn.

explore-json-error-filter-metric-6h: base failed where Loki and the PR answered; values beyond the Loki window not compared (1): query ('sum by (app) (count_
  • base failed where Loki and the PR answered; values beyond the Loki window not compared (1): query ('sum by (app) (count_over_time({namespace="prod"} | json | __error__="" [$__auto]))', 'ra: series sets differ: 1 only left ["('status', '400')"], 7 only
  • pixel diff 7.3%

explore-json-error-filter-metric-6h

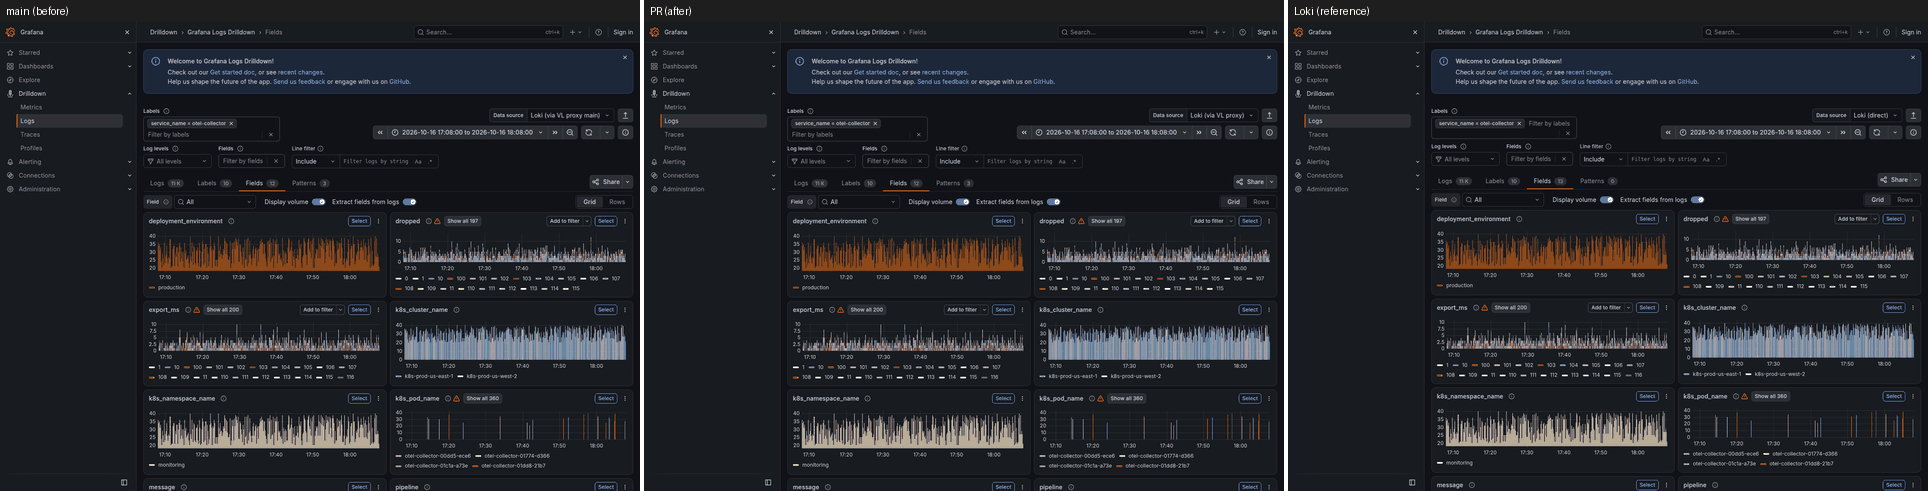
Core set montages (5): base | PR | Loki

dd-fields-1h

dd-fields-1h

dd-landing-1h

dd-landing-1h

dd-service-logs-1h

dd-service-logs-1h

explore-logs-plain-1h

explore-logs-plain-1h

explore-metric-plain-1h

explore-metric-plain-1h

All montages of this run: pr-visuals/pr-758.

szibis added a commit that referenced this pull request Oct 12, 2026
@szibis
szibis force-pushed the perf/json-valid-split branch from 98d6c25 to b6f4edc Compare October 12, 2026 19:27
@github-actions github-actions Bot added size/XL Extra large change and removed size/XL Extra large change labels Oct 12, 2026
@szibis
szibis marked this pull request as ready for review October 12, 2026 19:29
@github-actions github-actions Bot added size/XL Extra large change and removed size/XL Extra large change labels Oct 12, 2026
…, reading only the doubtful lines raw

sum by (app) (count_over_time({namespace="prod"} | json | __error__="" [5m]))
and the same shape with rate, bytes, a label filter or a grouping by a
parsed key, a stream label or service_name read every selected line as a
raw row: 0.5-2.4 s at 1 h (Loki 0.01-0.05 s) and a 502 on the row or byte
limit at 6-24 h. VictoriaLogs attaches no parser error, and Loki's
JSONParserErr depends on the query (JSONParser.Process walks a nested
object only when a required label starts with its key path).

The stats pushdown now splits the lines. A line not opening with a brace
after JSON whitespace fails Loki's parser and is dropped. A line
VictoriaLogs parses as one JSON object (a sentinel member spliced after
the brace and read back with unpack_json) and that holds none of the
constructs fastjson accepts and jsonparser rejects (a backslash in a key,
a value starting with . e E +, NaN or Inf) is accepted by Loki under every
hint set and counted by VictoriaLogs. Every other brace-opened line is
counted per bucket in the same scan and read as a raw row only from those
buckets, then evaluated by the row evaluator. A cached limit-1 probe looks
for the rejected constructs; only when it finds one is the scan repeated
with such lines moved to the raw rows. The parse-risk probes check only
lines VictoriaLogs parses. Window sums add bucket counts and raw lines at
each evaluation point before rate divides once. service_name is taken from
the first source field that is a stream label of the row, as Loki assigns
it at ingest, never from structured metadata.

The row evaluator's raw read keeps only _time, _stream, _msg, level and
the stored fields that can expose a required label, and its guards now
apply only to the raw-row set. The one-row pipeline-error lookup uses
Loki's JSON whitespace instead of RE2 \s, which includes the form feed.

Registry: semantics/json-error-filter-metric-split-pushdown (fixed);
open semantics/json-empty-value-label-series.

Follow-up changes folded into this commit:
- the split counts only the series the answer holds: label filters run before
  the stats pipe, so groups made of filtered-out or unparseable lines no longer
  count against -max-stats-query-series, and the limit applies to the merged
  answer
- the lines read as raw rows lose the grouped fields in the stats query, so
  they form one group; a stats response too large to read is left to the row
  evaluator
- the series limit is left to the merged answer: the stats read keeps at most
  twice the limit in groups as a memory guard, and a read past it goes to the
  row evaluator
- a split plan over the series limit ends with Loki's limit error, not a size
  error, and a merged answer over the limit fails before the raw rows are read
- e2e: the split answers under a low series limit as Loki does
- refreshed A/B results for J1-J5 at 1 h against Loki, 6 h and 24 h, and the
  control set
A split plan with no grouped or filtered label (an ungrouped sum over
`| json | __error__=""`) reached the unpack pipe with an empty field list and
sent `unpack_json fields () keep_original_fields`. The unpack is written only
when there is a label to read; the sentinel splice is the plan's parse.
…level fields

The row projection kept _time, _stream, _msg, level and the fields that can
expose a label of the plan. The detected_level derivation reads the stored
level fields and the OTLP severity_text, severity_number and severity, which no
label names, so a row whose level sits there lost it and fell to the keyword
scan or unknown. A plan that derives the level reads whole rows.
… level fields or not at all

A `| json | __error__=""` plan grouped by detected_level asks VictoriaLogs for
the stored detected_level and level fields alone (copied before the sentinel
splice), validated by storedLevelSeries, and never builds the derivation chain,
its presence probe or its witness. It is served only when every counted group
has a stored level and no other stored level field (severity, lvl, the OTLP
severity fields) can outrank it. A level only the body holds, a counted line
without one, a stored detected_level label, another stored level field, a read
past the group guard and a response too large to read leave the query to the
row evaluator, which derives the level of every line itself, as it does for the
lines read as raw rows. A filter on detected_level is not split.
@szibis
szibis force-pushed the perf/json-valid-split branch from af954ea to a5ba251 Compare October 16, 2026 18:07
@github-actions github-actions Bot added size/XL Extra large change and removed size/XL Extra large change labels Oct 16, 2026

This branch has not been deployed

No deployments
Sign up for free to join this conversation on GitHub. Already have an account? Sign in to comment

Labels

performance Performance scope/ci CI/CD scope/docs Documentation scope/proxy Proxy core scope/tests Tests size/XL Extra large change

Projects

None yet

Development

Successfully merging this pull request may close these issues.

1 participant