


Visualize the "Butterfly Effect" in Macroeconomics with AI
Demo • Features • Quick Start • Architecture • Contributing
Note
Project status: working prototype. The causal-inference engine (backend/) runs end-to-end; the frontend/ directory is a placeholder — the demo screenshots show the exploratory UI from the prototyping phase, not a shipped web app. Treat the FastAPI/Next.js badges below as the target architecture.
Domino-Agent is an AI-powered financial analysis system that automatically discovers and visualizes causal chains in macroeconomic events. Using Large Language Models (LLMs) and graph theory, it helps analysts understand how a single event can trigger a cascade of impacts across global markets.
- 🧠 AI-Driven Analysis: Leverages GPT-4/DeepSeek to identify hidden causal relationships
- 📊 Interactive Visualization: Beautiful force-directed graphs with real-time animations
- 🔗 Multi-Layer Impact Discovery: Recursively explores direct and downstream effects
- 💼 Professional Reports: Auto-generates executive summaries in financial language
- ⚡ Real-Time Processing: Fast API backend with modern React frontend
Try it yourself: Enter any macro event like "Fed raises interest rates by 50bps" and watch the causal chain unfold.
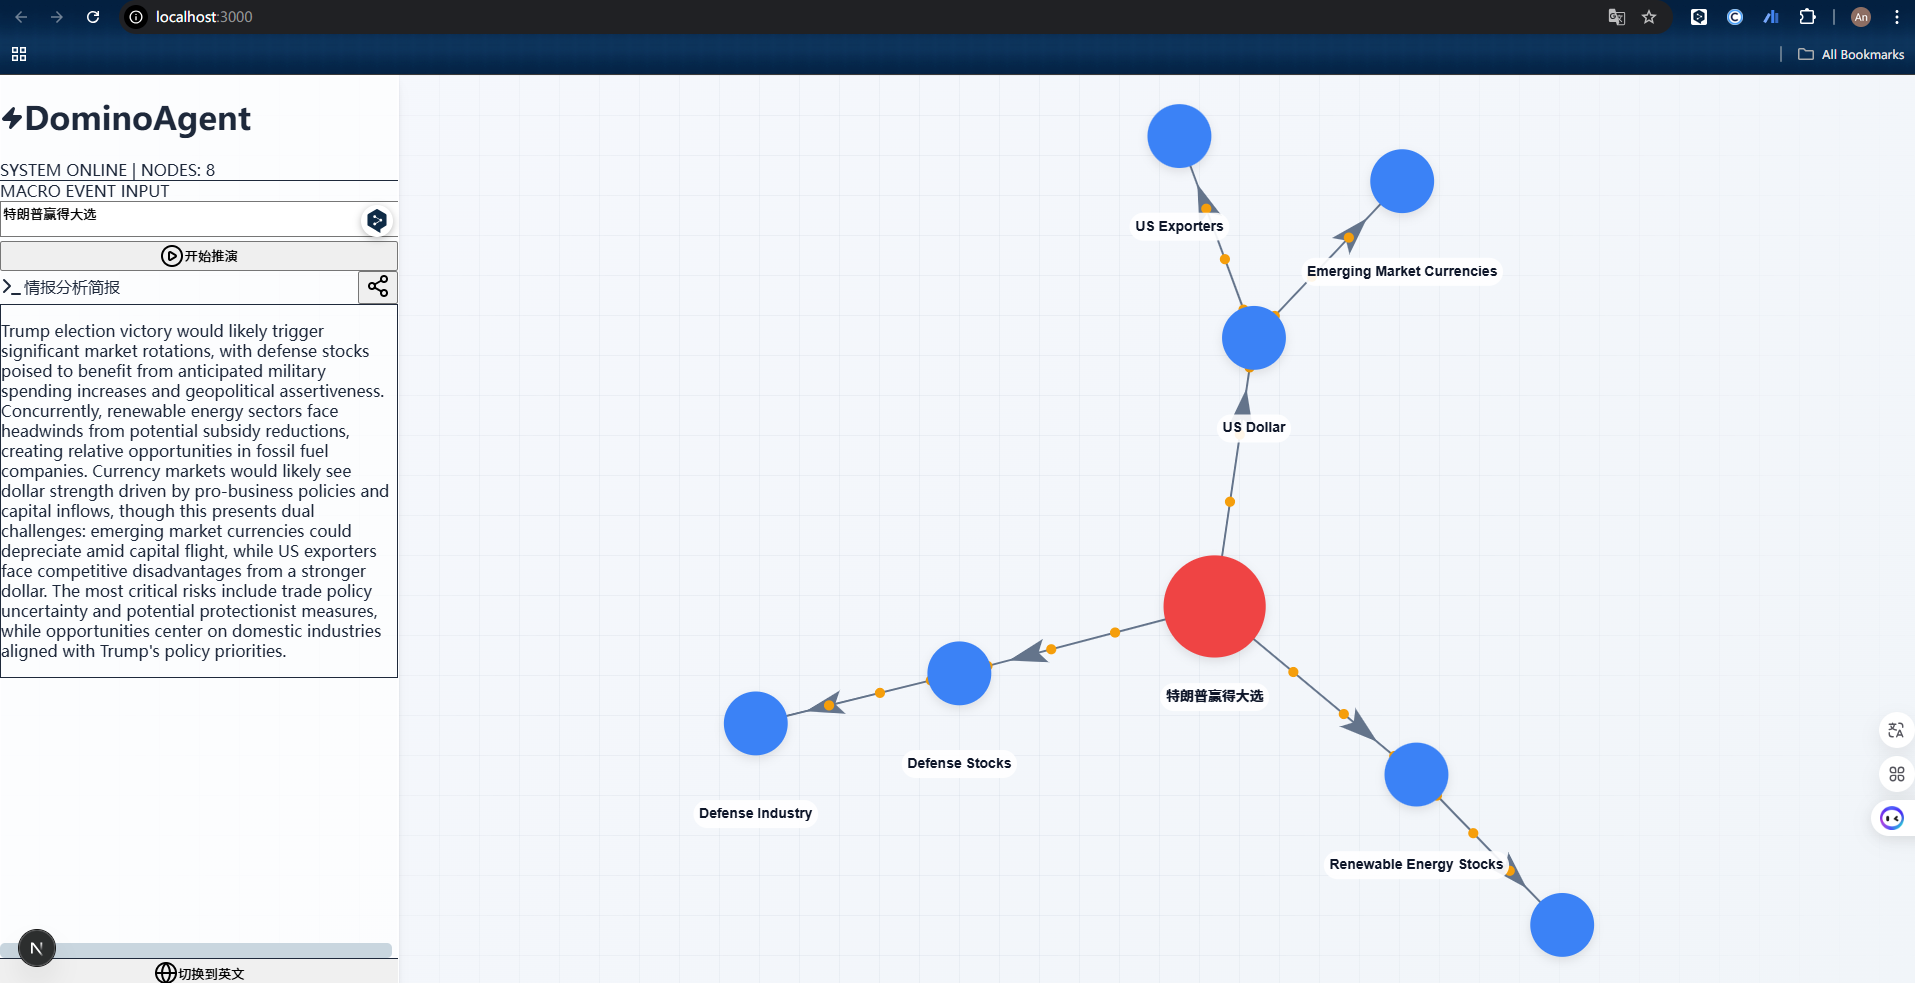
Analysis: "特朗普赢得大选" (Trump wins election)
- 🔴 Root Event: Political shift
- 🔵 Direct Impacts: US Dollar strength, Treasury yields, Defense stocks
- 🔵 Downstream Effects: Emerging market currencies, Renewable energy sector
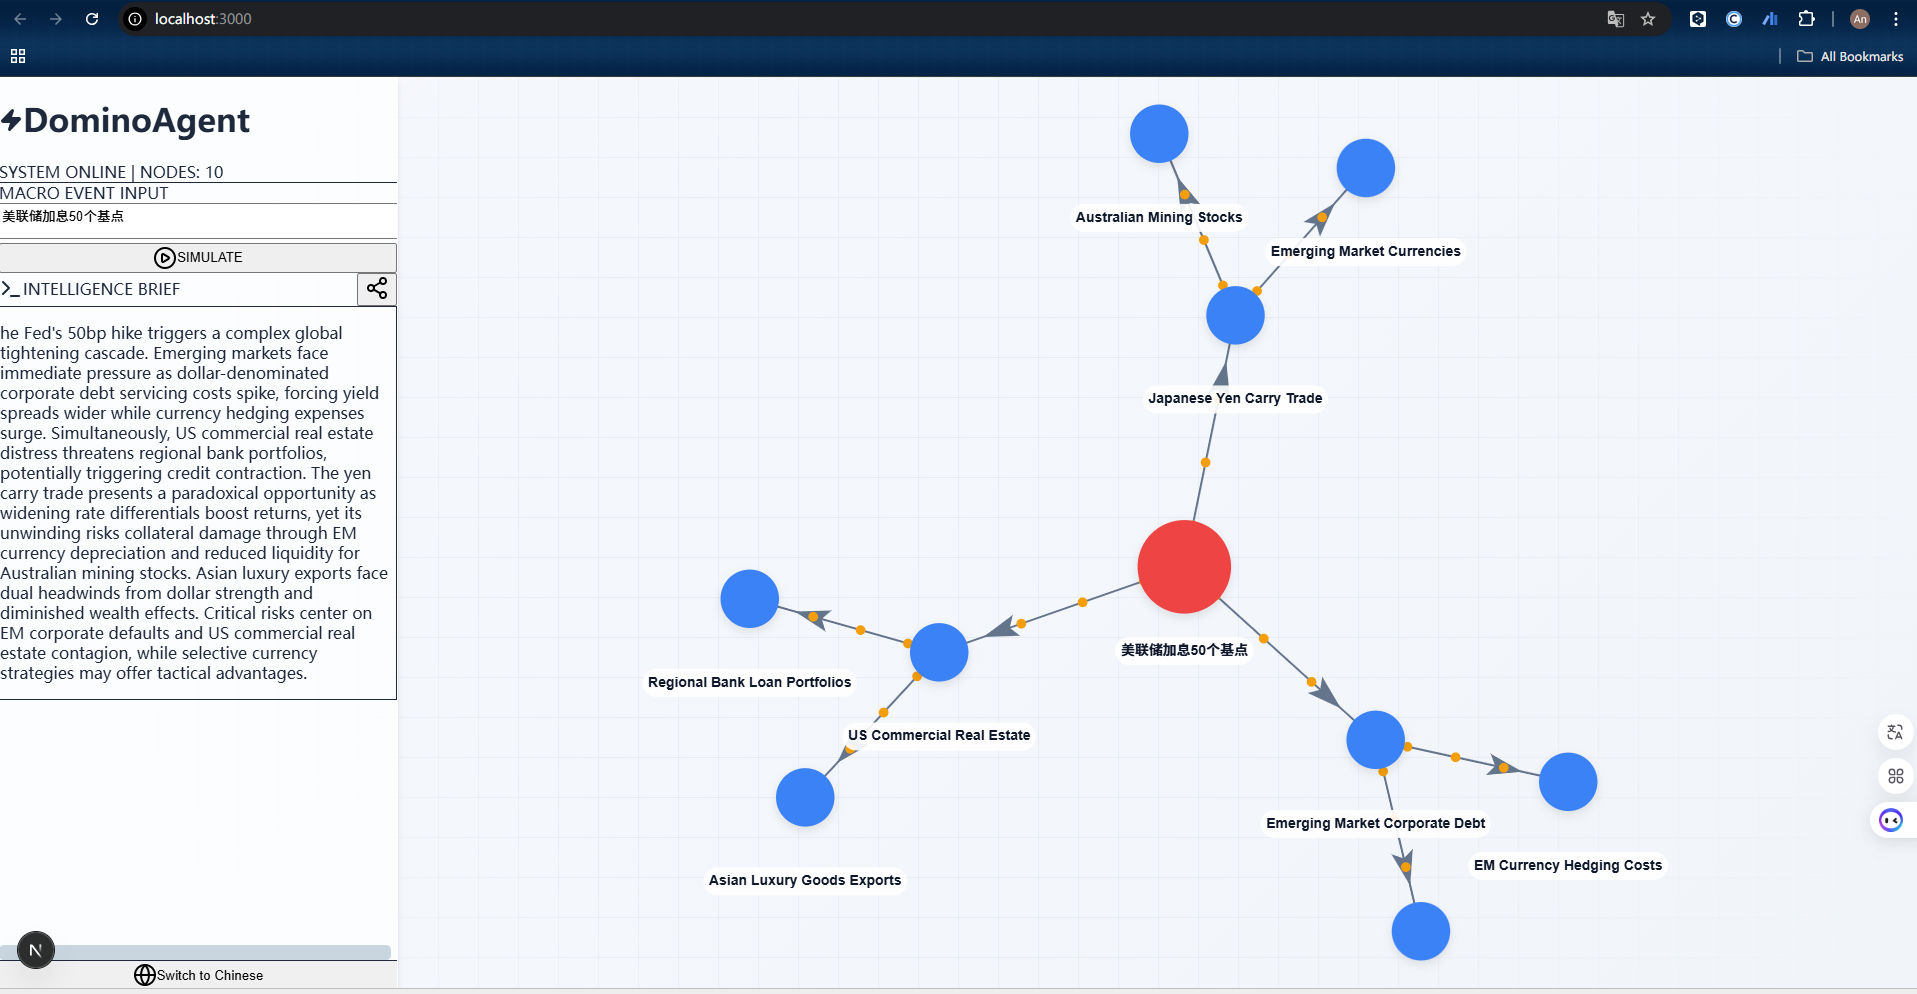
Analysis: "美联储加息 50 个基点" (Fed raises rates by 50bps)
- 🔴 Root Event: Monetary policy tightening
- 🔵 Multi-Agent Analysis: Detective proposes creative impacts, Reviewer validates
- 🔵 Console Logs: See the AI agents' debate in real-time
- Sidebar Controls: Dedicated control panel for clean UX
- Responsive Layout: Works on desktop and tablet
- Python 3.9+
- Node.js 18+
- OpenAI API Key (or compatible endpoint like DeepSeek)
cd backend

# Install dependencies
pip install -r requirements.txt

# Configure API Key
echo "OPENAI_API_KEY=your_key_here" > .env

# Start server
python -m uvicorn main:app --reload
The API will run on http://localhost:8000
cd frontend

# Install dependencies
npm install

# Start dev server
npm run dev
Open http://localhost:3000 in your browser.
- Enter a macro event in the sidebar (e.g., "Oil prices surge by 20%")
- Click "开始推演" (Simulate)
- Watch the causal graph build in real-time
- Hover over connections to see explanations
- Read the AI-generated report at the bottom
graph LR
    A[User Input] --> B[FastAPI Backend]
    B --> C[LangChain + LLM]
    C --> D[NetworkX Graph]
    D --> E[JSON Response]
    E --> F[Next.js Frontend]
    F --> G[ForceGraph2D]
    G --> H[Interactive Visualization]
Backend
- FastAPI (API framework)
- LangChain (LLM orchestration)
- NetworkX (Graph construction)
- Pydantic (Data validation)
Frontend
- Next.js 14 (App Router)
- TypeScript
- TailwindCSS
- react-force-graph-2d
- Framer Motion
AI
- OpenAI GPT-4 / DeepSeek
- Structured output parsing
- Recursive impact analysis
# User inputs: "Fed raises rates"
direct_impacts = llm.analyze(event, count=3)
# Returns: [
#   {target: "Bond Prices", sentiment: "negative"},
#   {target: "USD Strength", sentiment: "positive"},
#   {target: "Tech Stocks", sentiment: "negative"}
# ]for impact in direct_impacts:
downstream = llm.analyze(f"Change in {impact.target}", count=2)
graph.add_edge(event, impact.target)
for sub_impact in downstream:
graph.add_edge(impact.target, sub_impact.target)- Nodes colored by layer (Red = root, Blue = impacts)
- Arrows show directionality
- Particles animate along edges
- Tooltips display explanations
- Risk Assessment: Identify hidden risks in policy changes
- Investment Strategy: Discover sector rotation opportunities
- Economic Research: Visualize complex macro relationships
- Education: Teach economics through interactive simulations
- Scenario Planning: Explore "what-if" analyses
We welcome contributions! Here's how you can help:
- 🐛 Report Bugs: Open an issue with reproduction steps
- 💡 Suggest Features: Share your ideas in Discussions
- 🔧 Submit PRs: Fork, create a branch, and submit a pull request
- 📚 Improve Docs: Help us make the documentation better
See CONTRIBUTING.md for detailed guidelines.
This project is licensed under the MIT License - see the LICENSE file for details.
If you find this project useful, please consider giving it a ⭐ on GitHub!
- LangChain for LLM orchestration
- react-force-graph for graph visualization
- FastAPI for the amazing backend framework
- Vercel for Next.js and deployment tools
- Issues: GitHub Issues
- Discussions: GitHub Discussions
- Star this repo: ⭐ Give us a star!
Built with ❤️ by the Domino-Agent Team