Enter, for example, 2015-03-01 as the Start Date on the Team Dashboard sheet.
Look at the Cummulative Flow chart on the More Charts sheet.
Most of the work in progress has disappeared.
I expected to see the correct amount of work in progress over the range shown.

Enter, for example, 2015-03-01 as the Start Date on the Team Dashboard sheet.
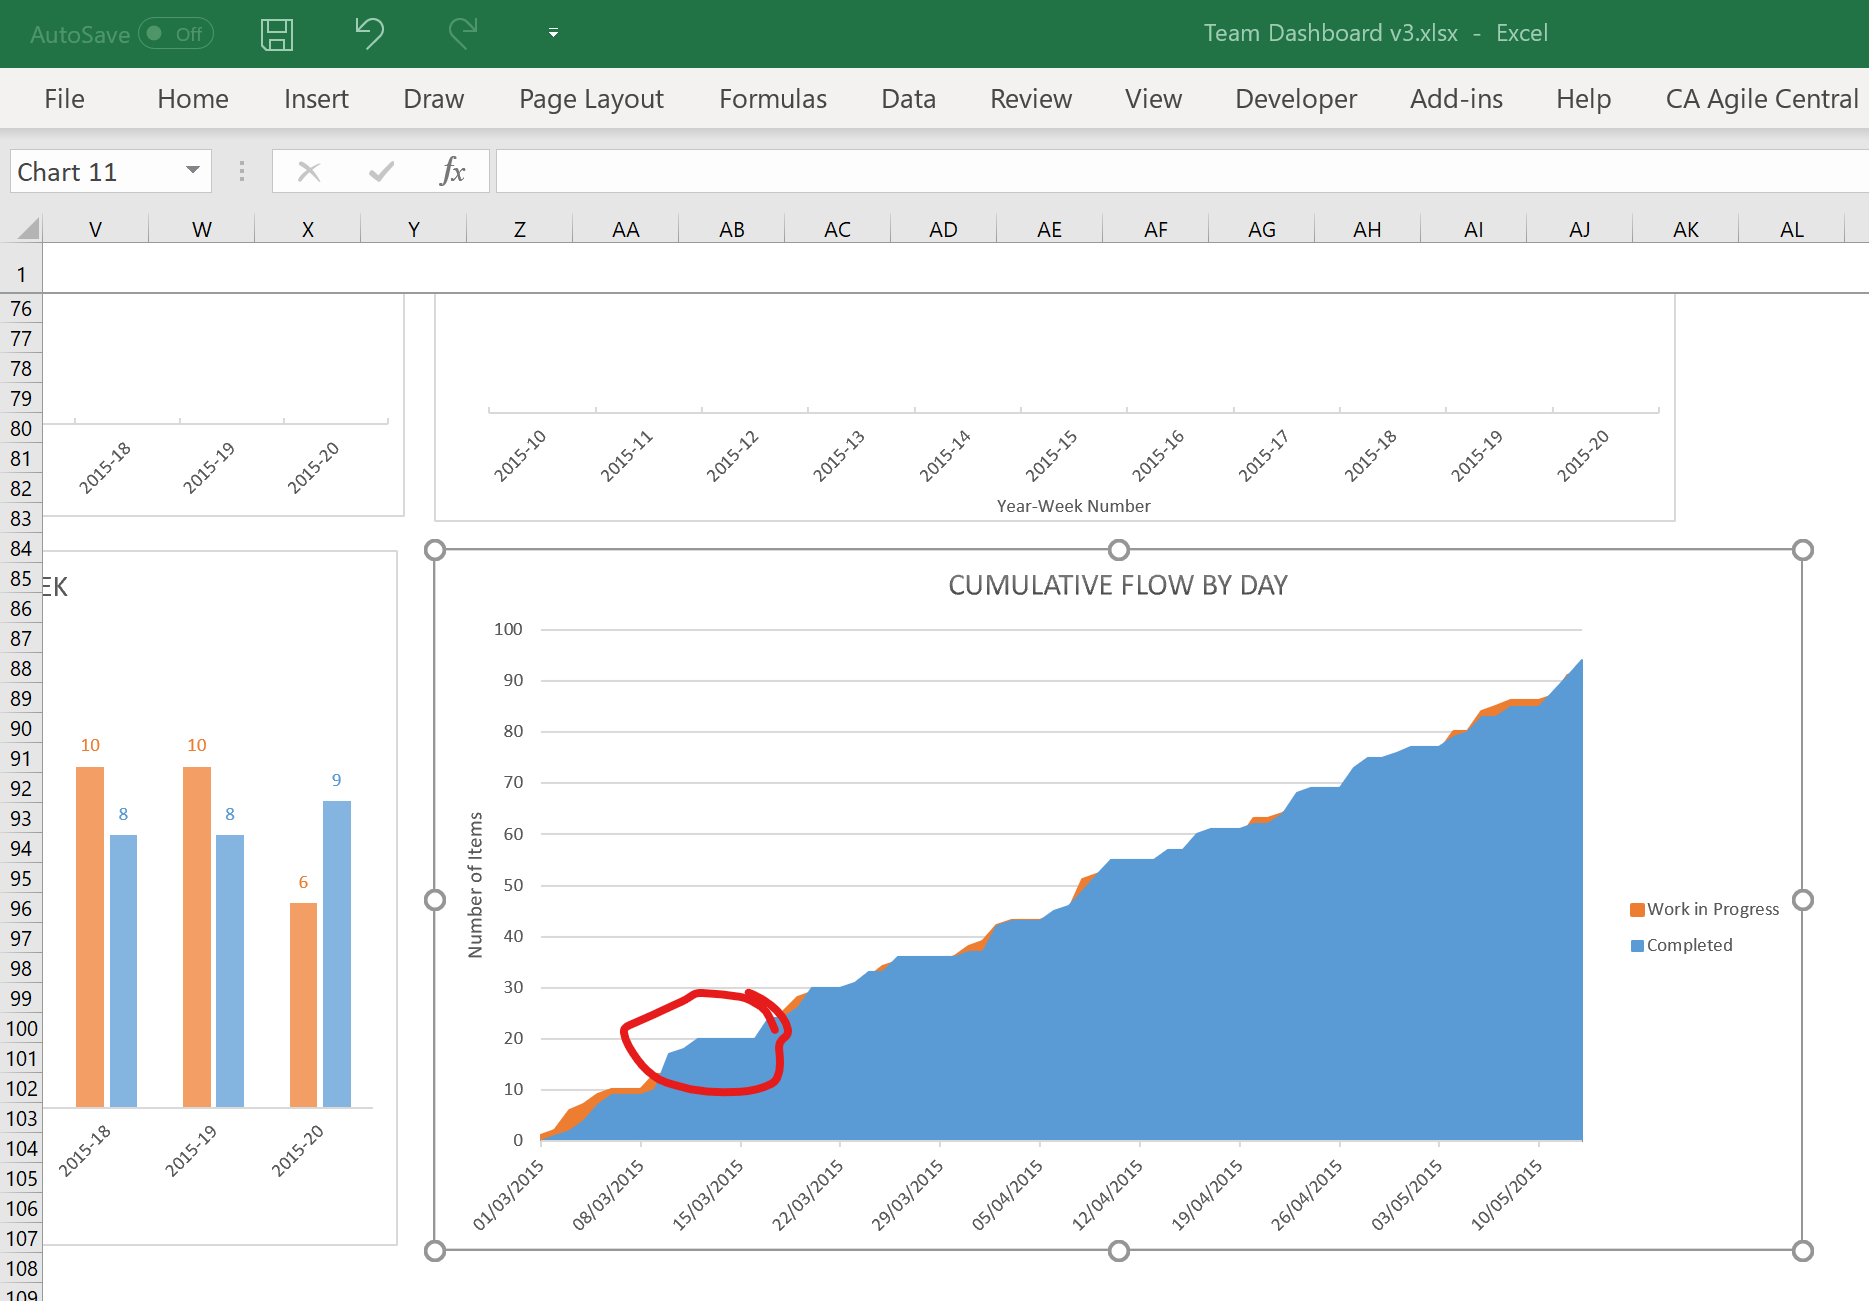
Look at the Cummulative Flow chart on the More Charts sheet.
Most of the work in progress has disappeared.
I expected to see the correct amount of work in progress over the range shown.